This is where you can find some VAERS analysis - lots of pretty pictures...
This is an R Markdown sheet generated from the VAERS data. For the most part, only figures are shown. I decided to show figures pertaining to Death, Female Reproductive Issues, Breakthrough COVID-19 infections and Cardiovascular and Immunological adverse events. Also included is some stuff on kids and Myocarditis.
I start by coalescing the .csv files downloaded from the VAERS website: https://vaers.hhs.gov/data/datasets.html
This is the total number of adverse events in the context of COVID-19 products from Fizer, Modrna and JJ
## # A tibble: 742,912 × 52
##    VAERS_ID SYMPTOM1     SYMPTOMVERSION1 SYMPTOM2    SYMPTOMVERSION2 SYMPTOM3
##       <dbl> <chr>                  <dbl> <chr>                 <dbl> <chr>
##  1   916600 Dysphagia               23.1 Epiglottit…            23.1 <NA>
##  2   916601 Anxiety                 23.1 Dyspnoea               23.1 <NA>
##  3   916602 Chest disco…            23.1 Dysphagia              23.1 Pain in ex…
##  4   916603 Dizziness               23.1 Fatigue                23.1 Mobility d…
##  5   916604 Injection s…            23.1 Injection …            23.1 Injection …
##  6   916605 Chills                  24   Confusiona…            24   Eye inflam…
##  7   916606 Pharyngeal …            23.1 <NA>                   NA   <NA>
##  8   916607 Abdominal p…            23.1 Chills                 23.1 Sleep diso…
##  9   916608 Diarrhoea               23.1 Nasal cong…            23.1 <NA>
## 10   916609 Vaccination…            23.1 Vaccinatio…            23.1 Vaccinatio…
## # … with 742,902 more rows, and 46 more variables: SYMPTOMVERSION3 <dbl>,
## #   SYMPTOM4 <chr>, SYMPTOMVERSION4 <dbl>, SYMPTOM5 <chr>,
## #   SYMPTOMVERSION5 <dbl>, RECVDATE <chr>, STATE <chr>, AGE_YRS <dbl>,
## #   CAGE_YR <dbl>, CAGE_MO <dbl>, SEX <chr>, RPT_DATE <lgl>,
## #   SYMPTOM_TEXT <chr>, DIED <chr>, DATEDIED <chr>, L_THREAT <chr>,
## #   ER_VISIT <lgl>, HOSPITAL <chr>, HOSPDAYS <dbl>, X_STAY <lgl>,
## #   DISABLE <chr>, RECOVD <chr>, VAX_DATE <chr>, ONSET_DATE <chr>, …
## [1] 742912Percent of VAERS reports made by Females
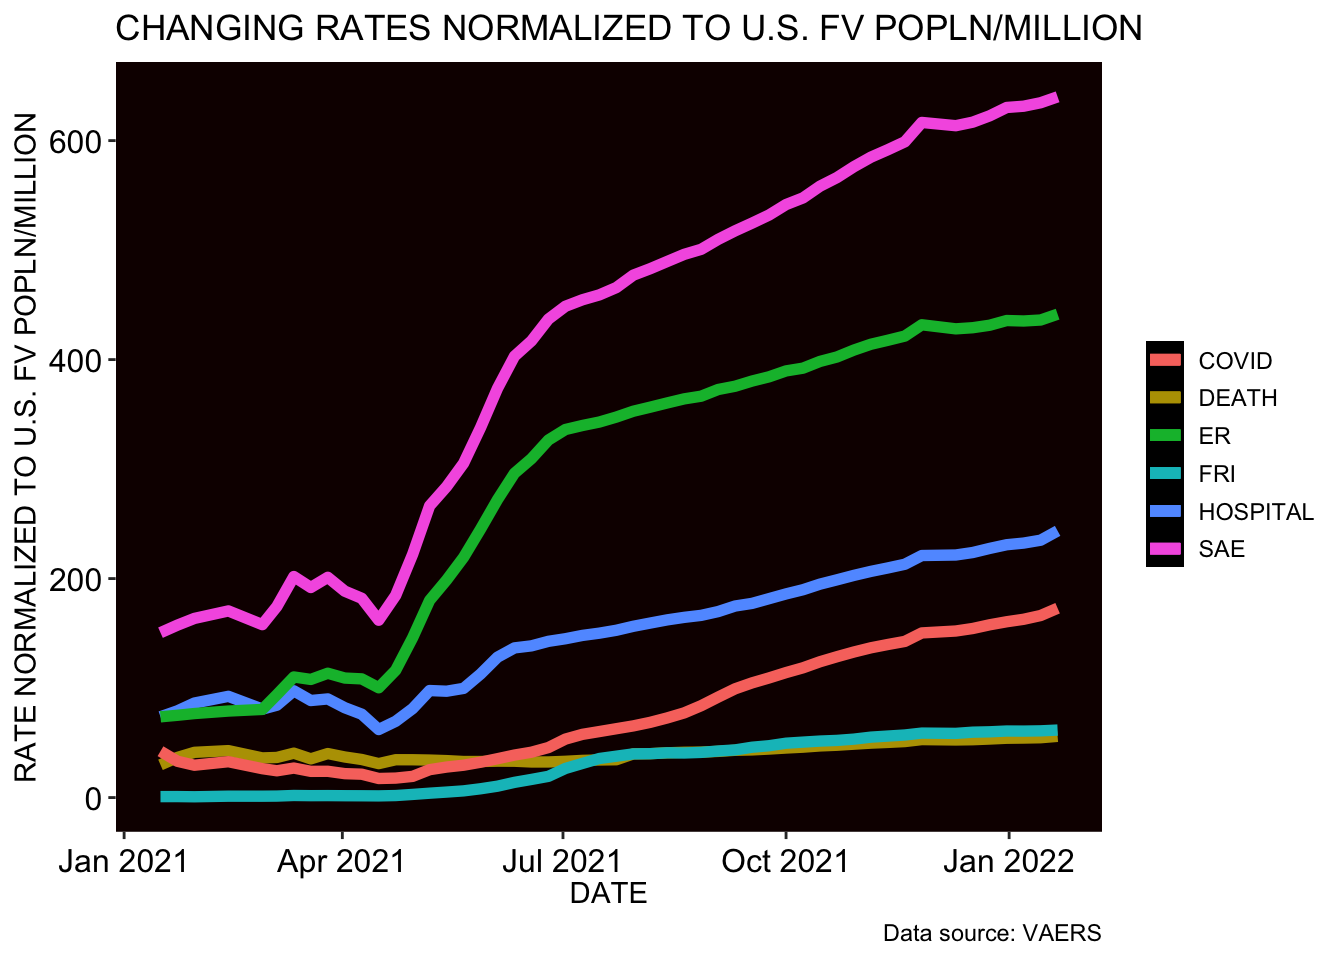
## [1] 66.94629The following table is a summary of some variables in the context of COVID-19 product roll-out including changing fully-injected numbers (FV = Fully Vaccinated; SAE = Severe Adverse Events; ER = Emergency doctor visits; COVID = Breakthrough infections; FRI = Female Reproductive Issues)
##          DATE    IDs        FV    Dose_1 DEATH HOSPITAL    ER    SAE COVID
## 1  2021-01-16   1431   4582089  15840000   137      338   338    690   194
## 2  2021-01-23   2160   7664179  22360000   281      607   576   1207   254
## 3  2021-01-30   2946  11037313  29330000   456      953   847   1806   326
## 4  2021-02-13   5351  18895522  43170000   810     1747  1493   3221   619
## 5  2021-02-27   9286  27167910  55570000   984     2195  2187   4291   717
## 6  2021-03-05  14701  31720149  64490000  1162     2676  2980   5535   776
## 7  2021-03-12  20586  35000000  76320000  1419     3412  3855   7065   943
## 8  2021-03-19  27955  44145522  88480000  1561     3913  4763   8470  1057
## 9  2021-03-26  34121  48700000 100810000  1957     4387  5529   9796  1169
## 10 2021-04-02  40348  57980000 113530000  2149     4758  6329  10930  1267
## 11 2021-04-09  46163  64420000 126920000  2240     4906  6983  11724  1375
## 12 2021-04-16  57641  80610000 138040000  2500     5009  8084  13057  1404
## 13 2021-04-23  75370  89250000 146410000  3084     6215 10375  16478  1587
## 14 2021-04-30 108191  99670000 149980000  3442     8099 14553  22145  1930
## 15 2021-05-07 146622 108930000 158290000  3731    10648 19620  29024  2776
## 16 2021-05-14 182559 118990000 162850000  4015    11557 23641  33791  3317
## 17 2021-05-21 217716 126610000 168980000  4169    12625 27774  38650  3742
## 18 2021-05-28 252523 132770000 173240000  4372    14977 32547  44860  4285
## 19 2021-06-04 284041 136640000 175910000  4547    17520 37184  51068  4850
## 20 2021-06-11 316929 141580000 178450000  4700    19354 41937  57073  5497
## 21 2021-06-18 346967 148460000 180620000  4825    20571 45952  61917  6151
## 22 2021-06-25 368162 151620000 182600000  4931    21636 49511  66255  6927
## 23 2021-07-02 388900 155880000 184430000  5163    22612 52399  69941  8324
## 24 2021-07-09 397262 158290000 186010000  5375    23441 53789  71963  9139
## 25 2021-07-16 403335 160410000 187820000  5508    24087 55016  73645  9671
## 26 2021-07-23 409924 162170000 190170000  5604    24778 56357  75536 10199
## 27 2021-07-30 419295 163870000 193150000  6538    25634 57820  78186 10728
## 28 2021-08-06 427831 165640000 196470000  6639    26402 59061  80011 11381
## 29 2021-08-13 436175 167350000 199700000  6841    27160 60317  81937 12174
## 30 2021-08-20 450602 169590000 202730000  7018    27913 61754  84137 13117
## 31 2021-08-27 473722 172170000 205600000  7149    28651 63115  86209 14448
## 32 2021-09-03 499779 174120000 208210000  7344    29577 64893  88768 15979
## 33 2021-09-10 521667 177430000 210240000  7662    31041 66657  91839 17626
## 34 2021-09-17 541594 180570000 212270000  7859    32024 68692  94740 18917
## 35 2021-09-24 551836 182590000 213950000  8091    33172 70166  97147 19953
## 36 2021-10-01 565282 184340000 215810000  8342    34288 71831  99838 21042
## 37 2021-10-08 577804 186920000 217410000  8606    35484 73308 102373 22155
## 38 2021-10-15 591934 188280000 218850000  8879    36702 74997 105130 23358
## 39 2021-10-22 603738 189920000 220230000  9077    37769 76423 107542 24432
## 40 2021-10-29 618548 190990000 222160000  9315    38758 78060 110045 25393
## 41 2021-11-05 632823 191820000 224030000  9538    39625 79418 112192 26240
## 42 2021-11-12 642994 192940000 224660000  9721    40465 80584 114161 26975
## 43 2021-11-19 654539 194140000 228180000  9931    41370 81831 116275 27688
## 44 2021-11-26 675942 194670000 231370000 10309    43034 84061 120033 29272
## 45 2021-12-10 686032 199180000 237470000 10478    44126 85266 122221 30299
## 46 2021-12-17 696446 201580000 240320000 10651    45115 86502 124345 31127
## 47 2021-12-24 705991 203027000 241520000 10856    46202 87586 126418 32039
## 48 2021-12-31 714177 203240000 241580000 11013    46933 88549 128095 32636
## 49 2022-01-07 721107 205410000 245650000 11166    47743 89406 129701 33449
## 50 2022-01-14 726839 206940000 247940000 11311    48642 90258 131323 34407
## 51 2022-01-21 742912 209080000 250030000 11695    50926 92307 133809 36159
##      FRI COVID_deaths
## 1      4        38694
## 2      7       109630
## 3      8       131892
## 4     24       170988
## 5     34       198287
## 6     43       209042
## 7     67       218469
## 8     77       226014
## 9     88       232899
## 10    98       238917
## 11   105       245843
## 12   123       249289
## 13   165       253959
## 14   287       259751
## 15   436       263832
## 16   597       269044
## 17   774       272431
## 18  1067       277845
## 19  1421       280390
## 20  1967       282889
## 21  2460       285210
## 22  2940       287735
## 23  4145       289963
## 24  4934       290463
## 25  5723       292672
## 26  6130       294419
## 27  6538       295971
## 28  6639       299877
## 29  6841       302694
## 30  6904       307669
## 31  7105       316829
## 32  7405       326638
## 33  7722       339140
## 34  8303       354557
## 35  8646       365749
## 36  9153       374992
## 37  9467       389782
## 38  9716       406120
## 39  9915       415867
## 40 10194       426139
## 41 10588       434981
## 42 10841       443473
## 43 11096       451990
## 44 11465       461093
## 45 11676       477787
## 46 12040       490067
## 47 12196       496626
## 48 12353       501166
## 49 12470       516675
## 50 12611       529145
## 51 12891       542325
This is the change in absolute number of VAERS IDs per year.
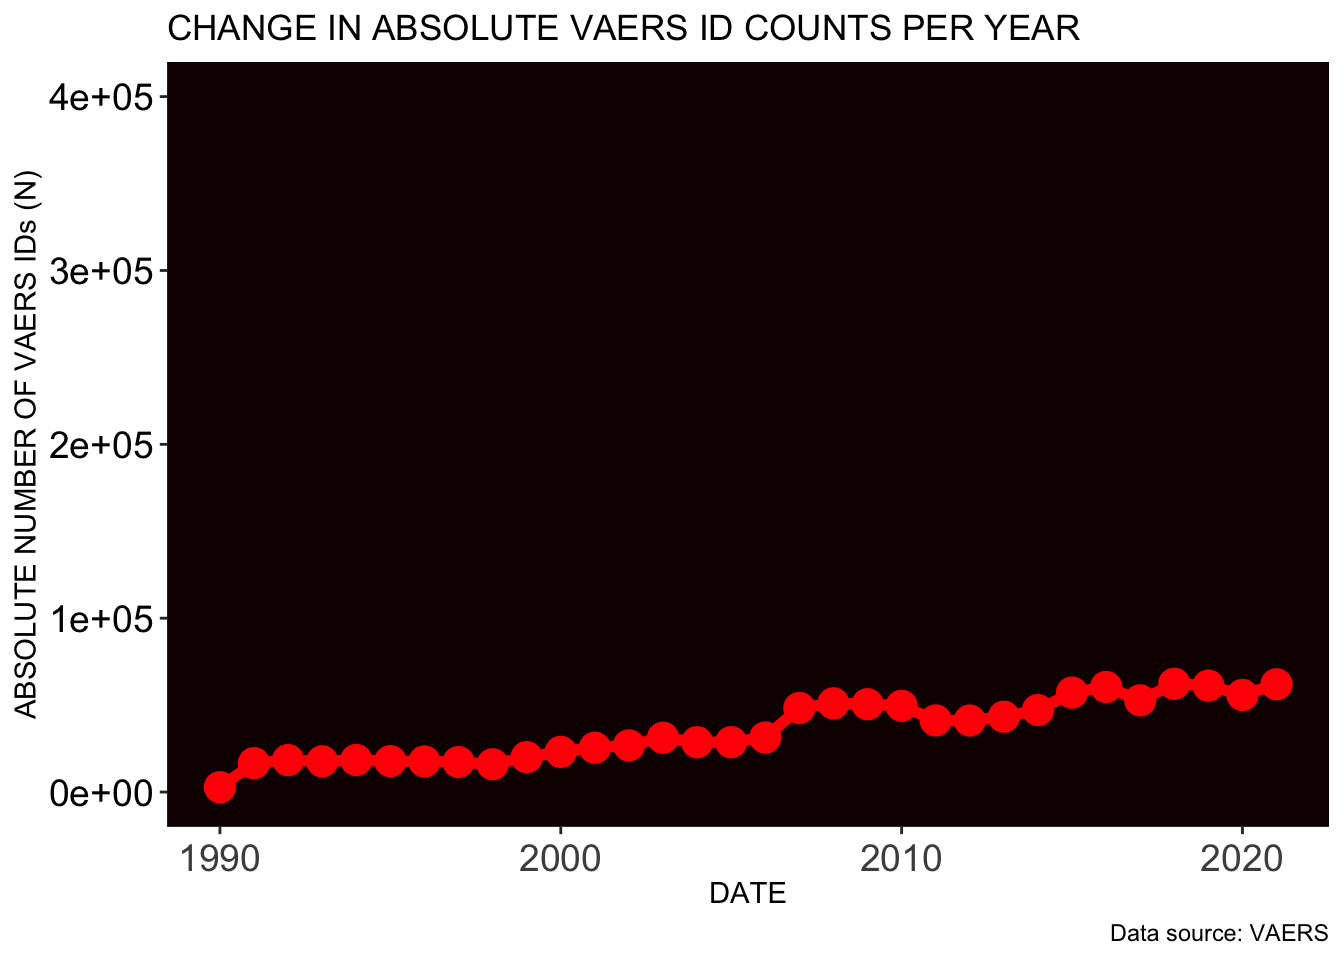 These are the VAERS ID counts for the past 30 years (absolute counts).
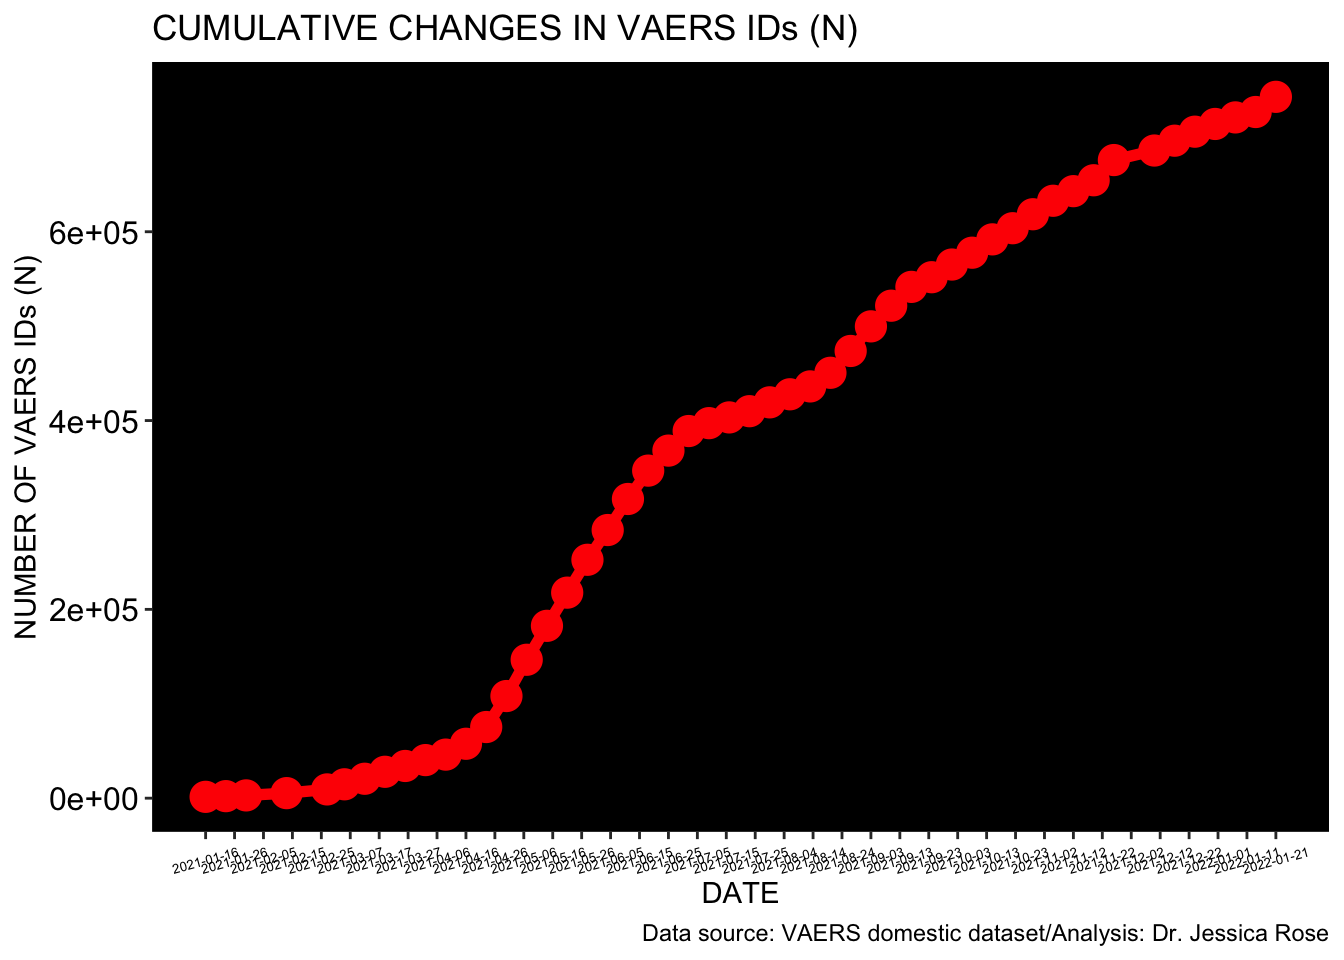
This is the cumulative number of VAERS IDs (N) so far for 2021 in the context of the COVID-19 products.
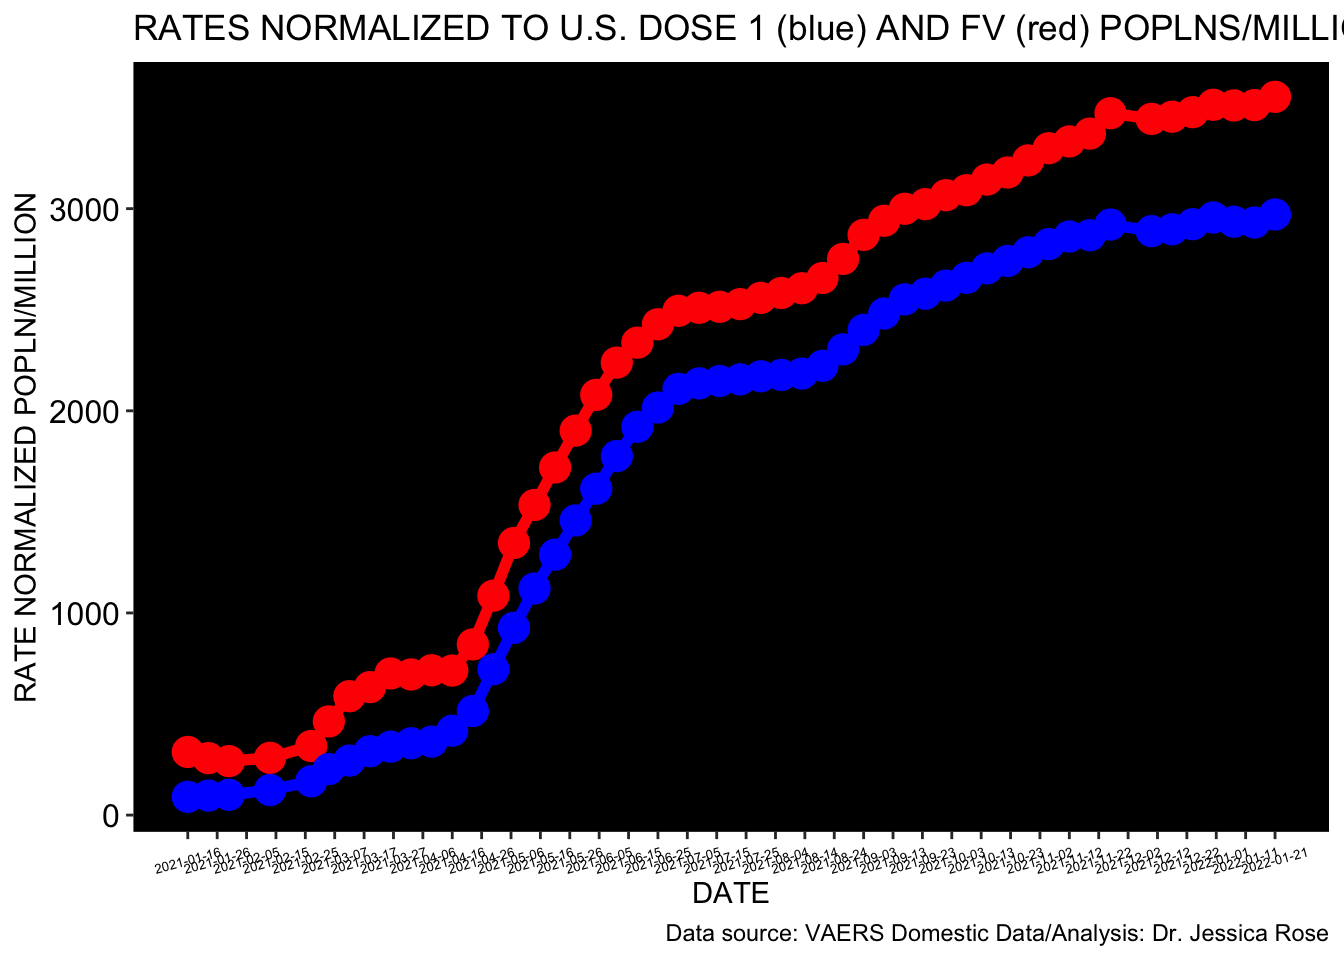
This is the number of VAERS IDs (N) so far for 2021 in the context of the COVID-19 products normalized to FULLY INJECTED population per million.
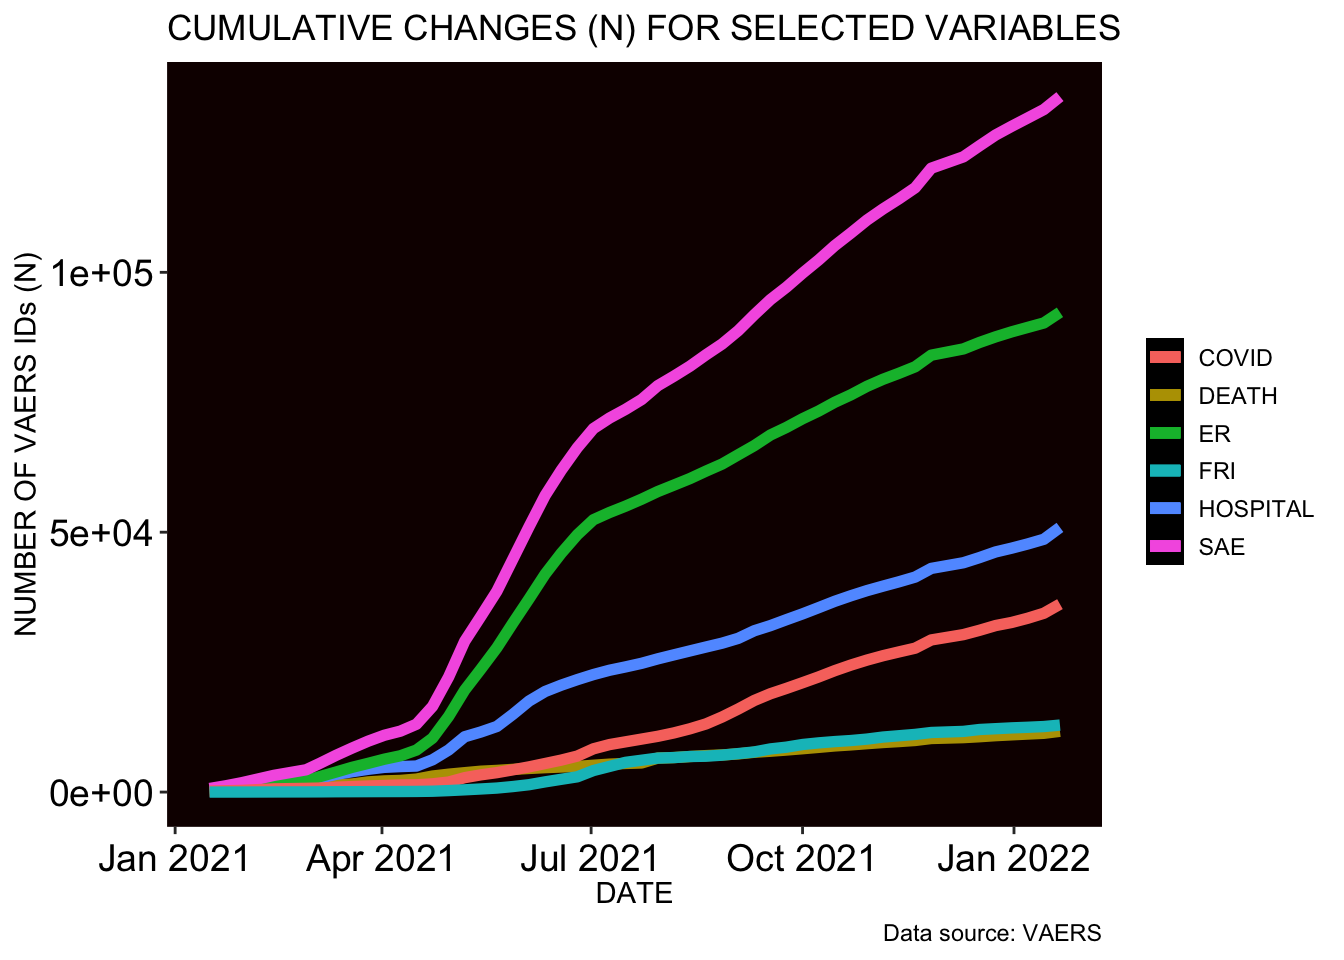
These are the trajectories of cumulative data for the respective groups.
 These are the trajectories of normalized data for the respective groups (normalized to US FULLY INJECTED population per million).
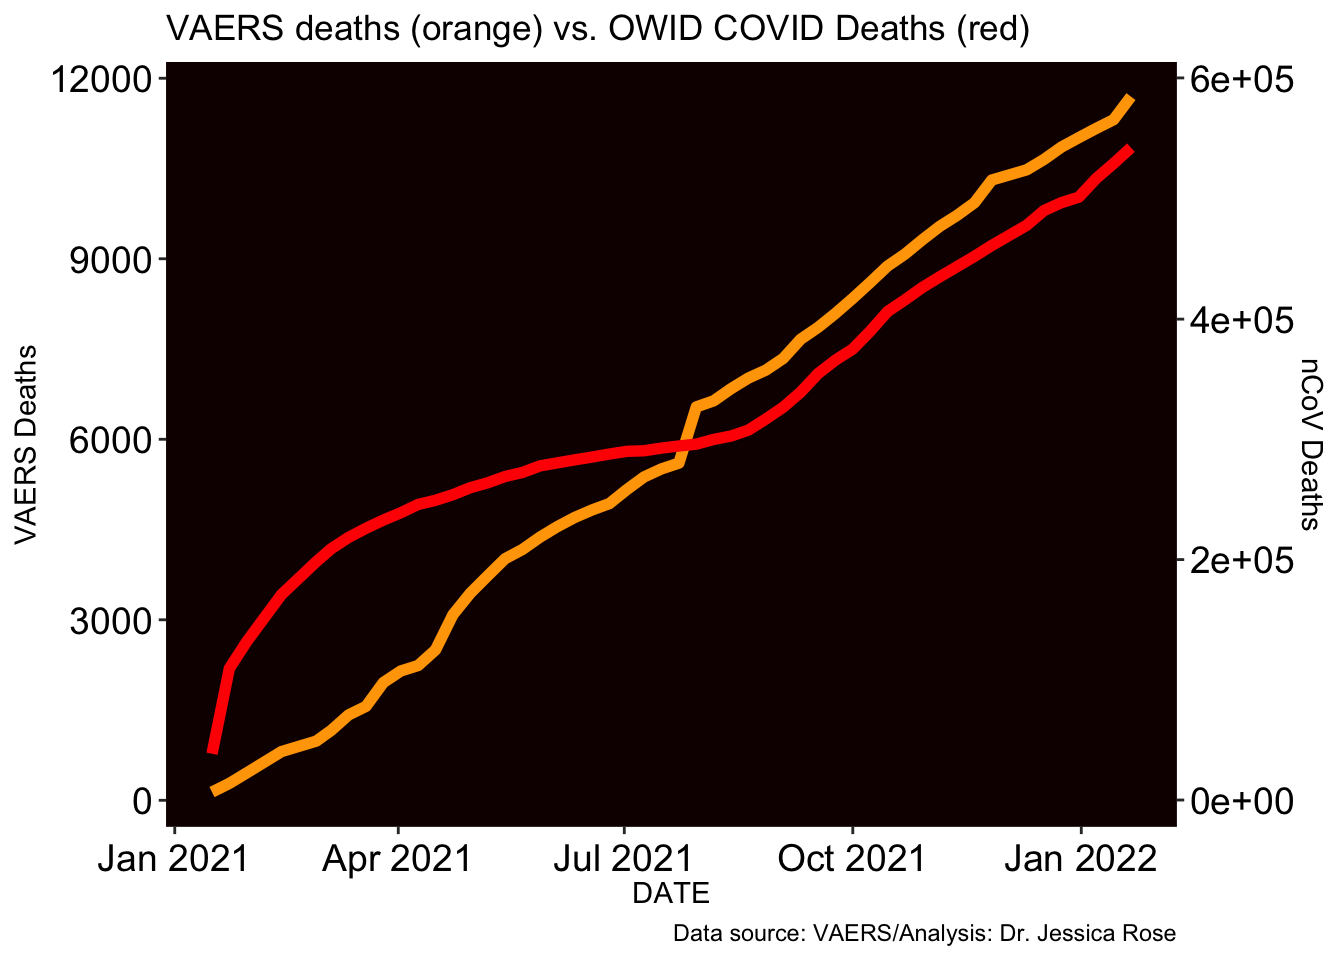
 These are the trajectories of cumulative data for Deaths from VAERS and COVID deaths from OWID.
 This is the number of birth defects.
## [1] 479This is the number of deaths and the percentage per total AEs.
## [1] 11695## [1] 1.574211These are the number of hospitalizations and emergency doctor visits.
## [1] 50926## [1] 92307These are the numbers of Severe Adverse Events (SAEs): Deaths, Hospital, ER, Life threatening, Disabling, Birth defect with the total SAE count and percentage of all AEs.
## [1] 11695## [1] 50926## [1] 92307## [1] 11841## [1] 13030## [1] 479## [1] 133809## [1] 18.01142## [1] 66018Histogram showing distribution of SAEs according to age group
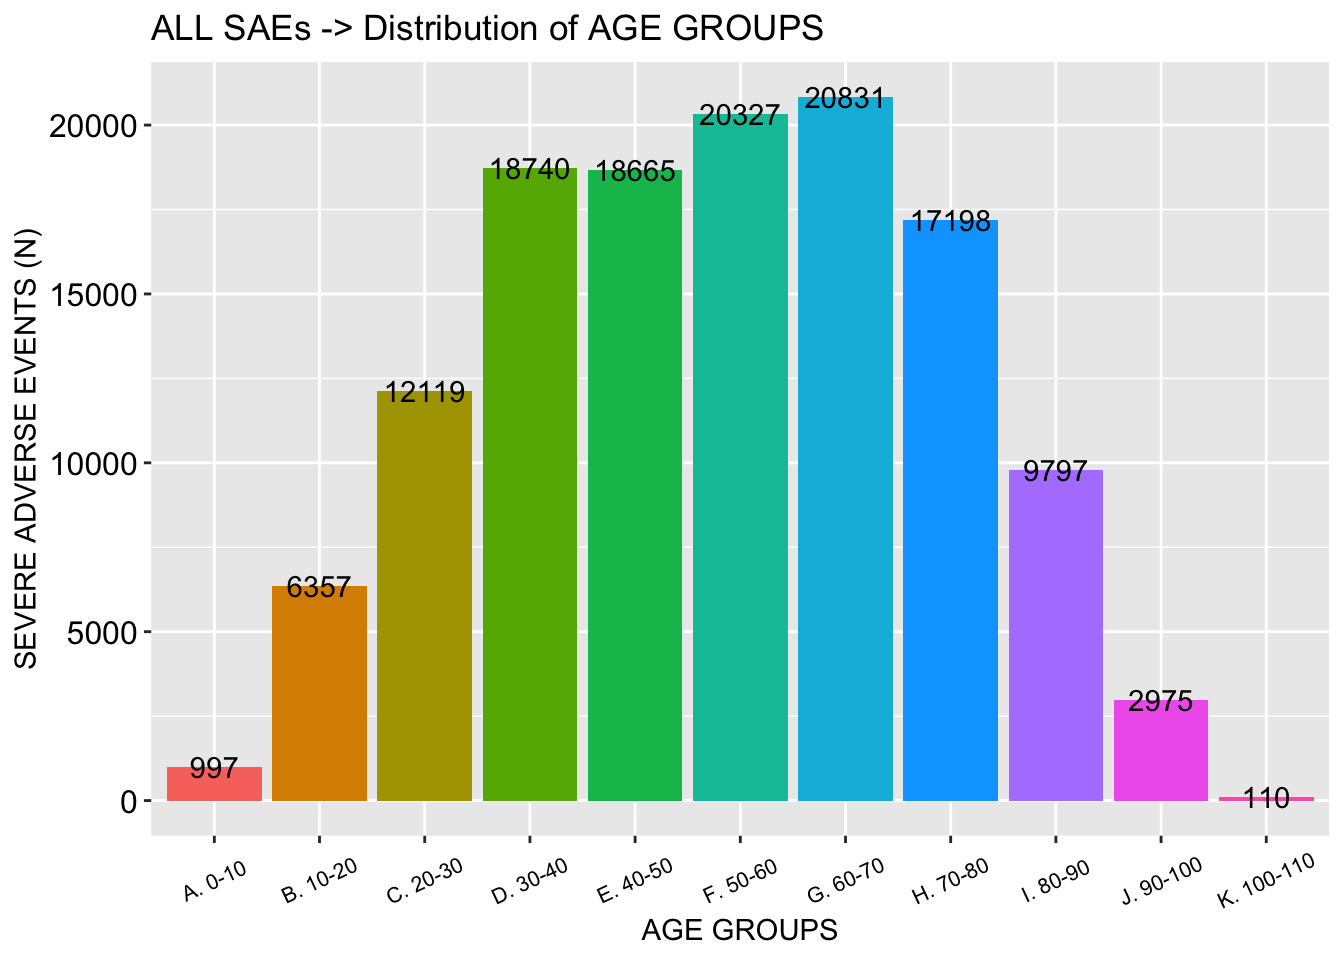 Actual VAERS SAE percentage compared to Standard VAERS SAE percentage
## Percent_SAE SAE PERC
## 1 Standard 110000 15
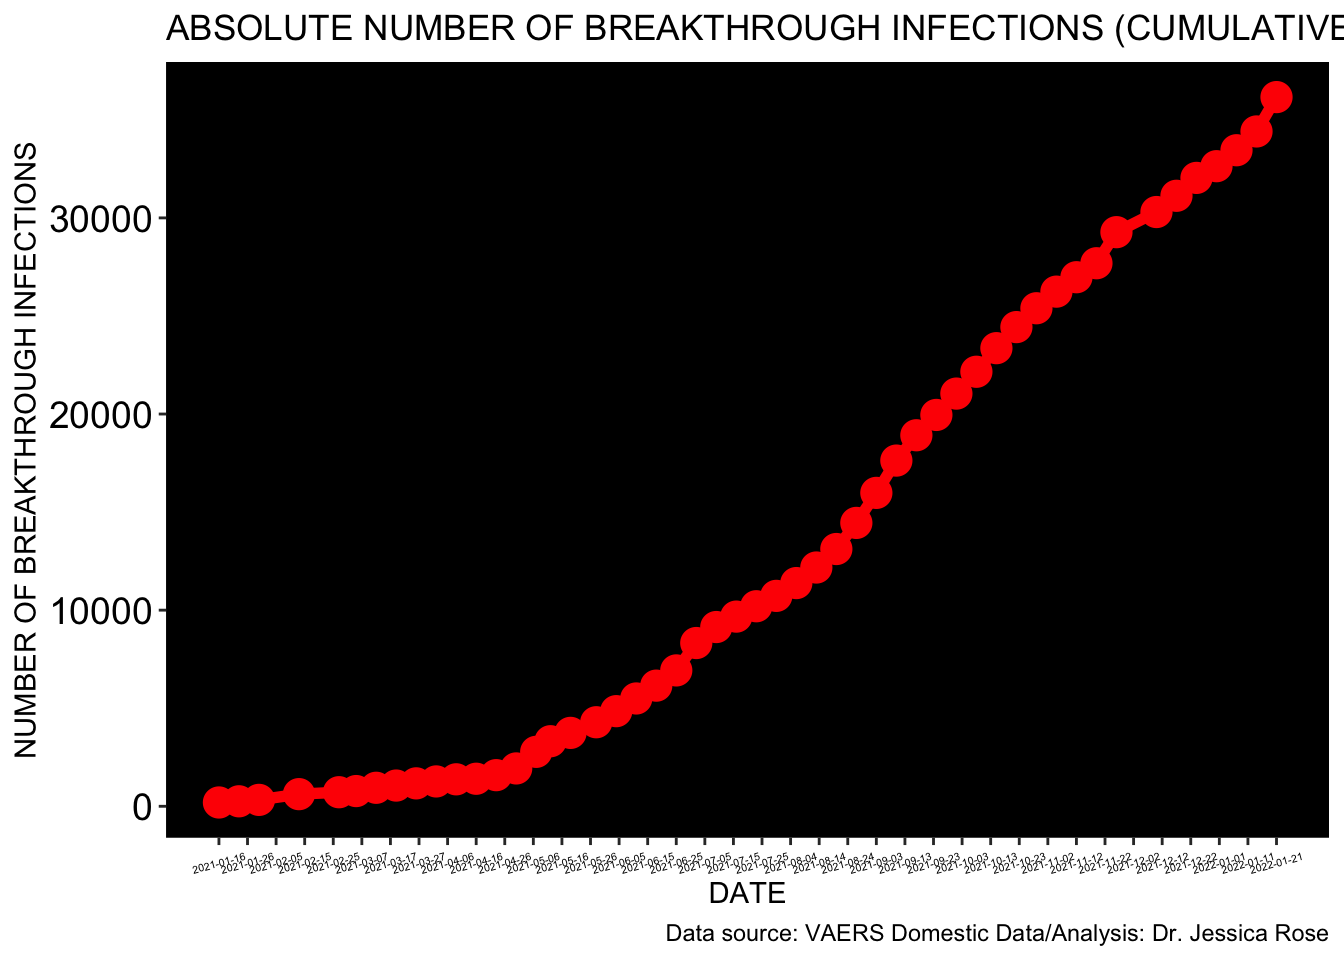
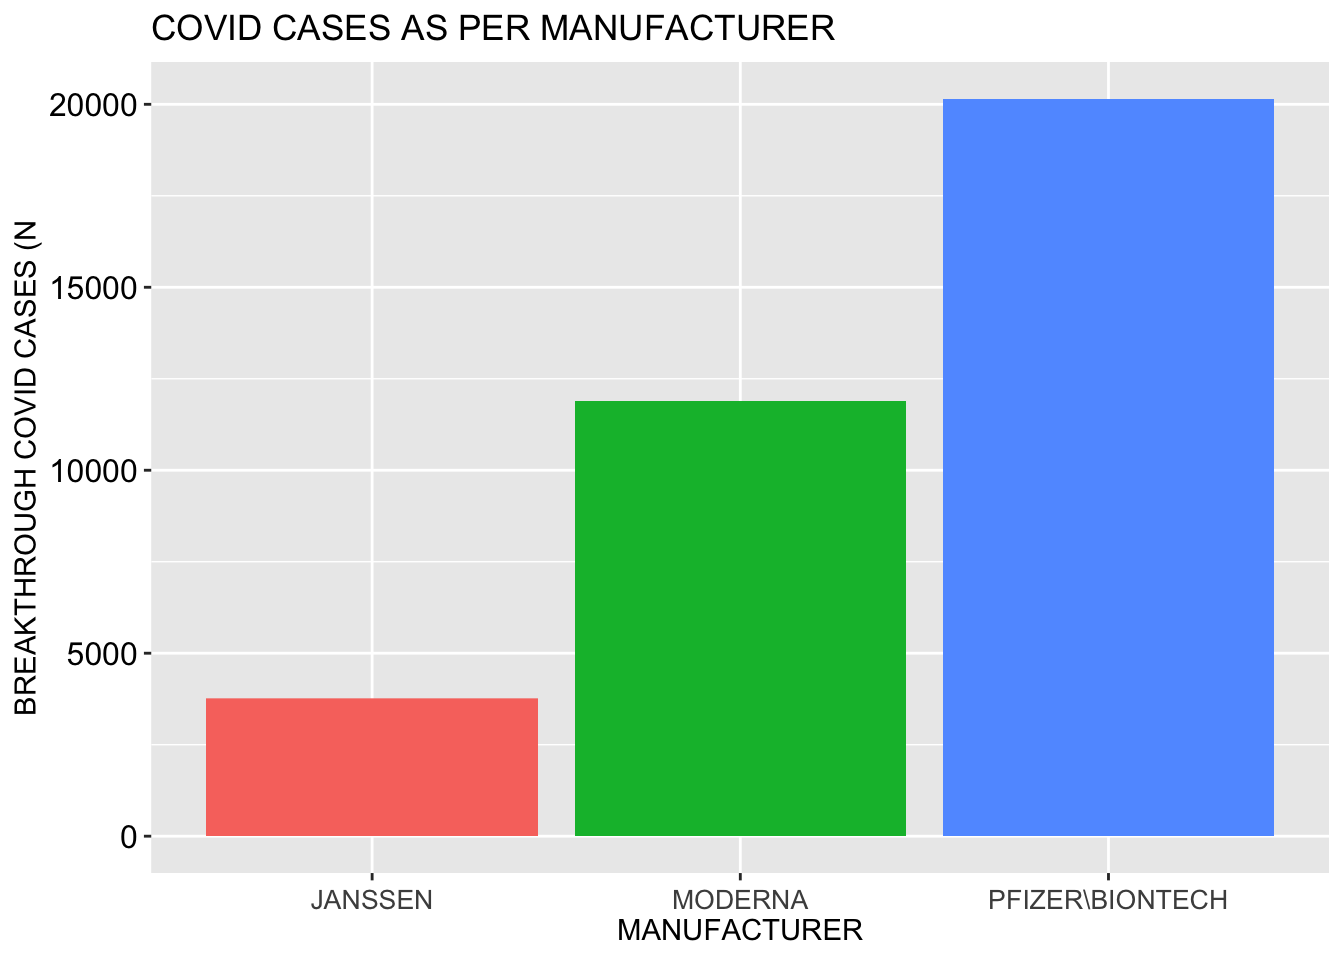
## 2 Actual 133809 18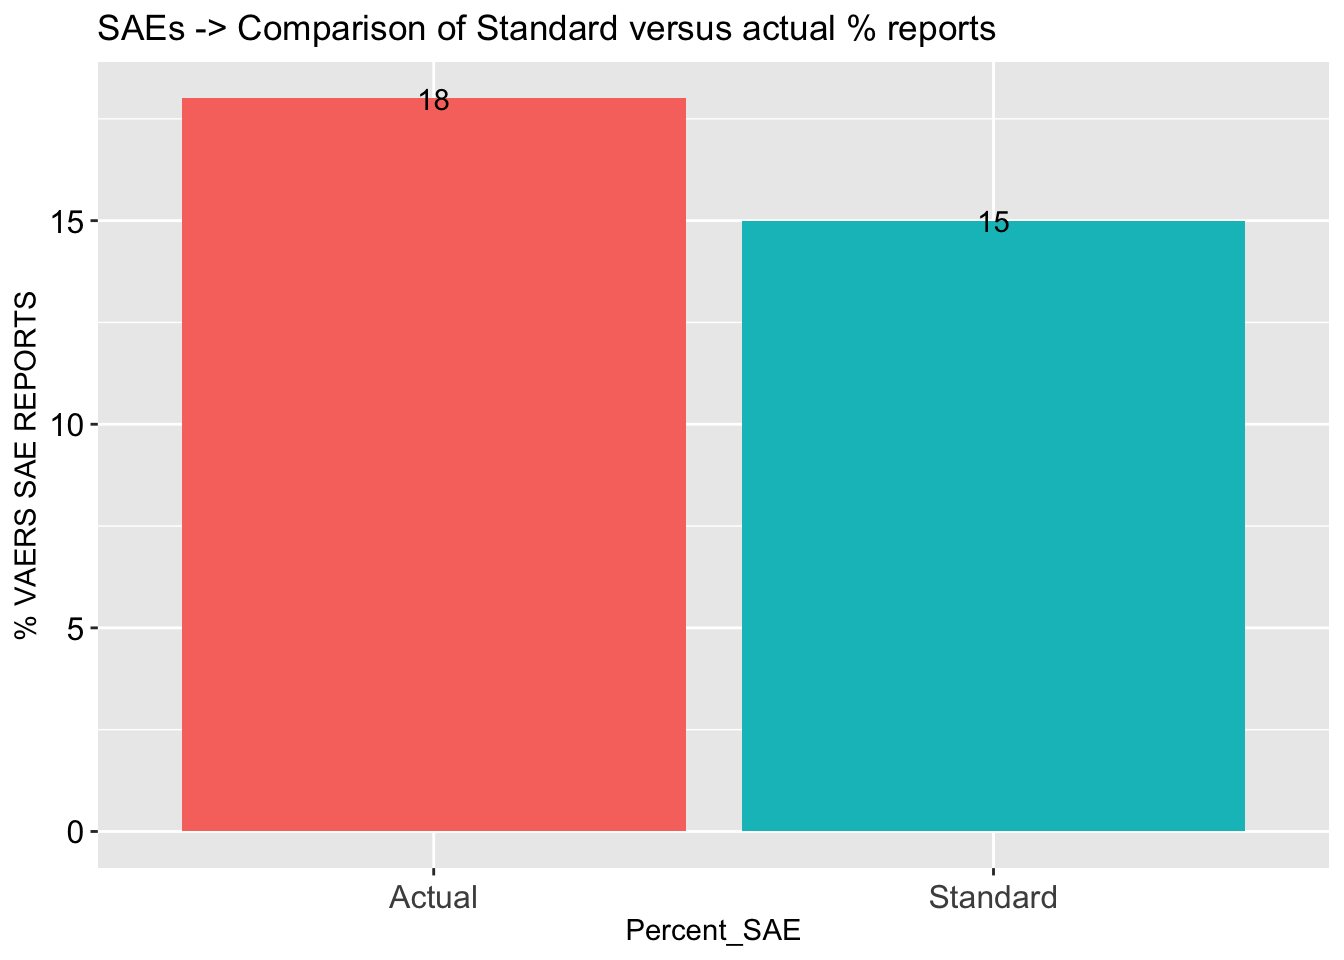 Breakthrough COVID-19 case count AND PERCENTAGE of total ID count
## [1] 36159## [1] 4.867198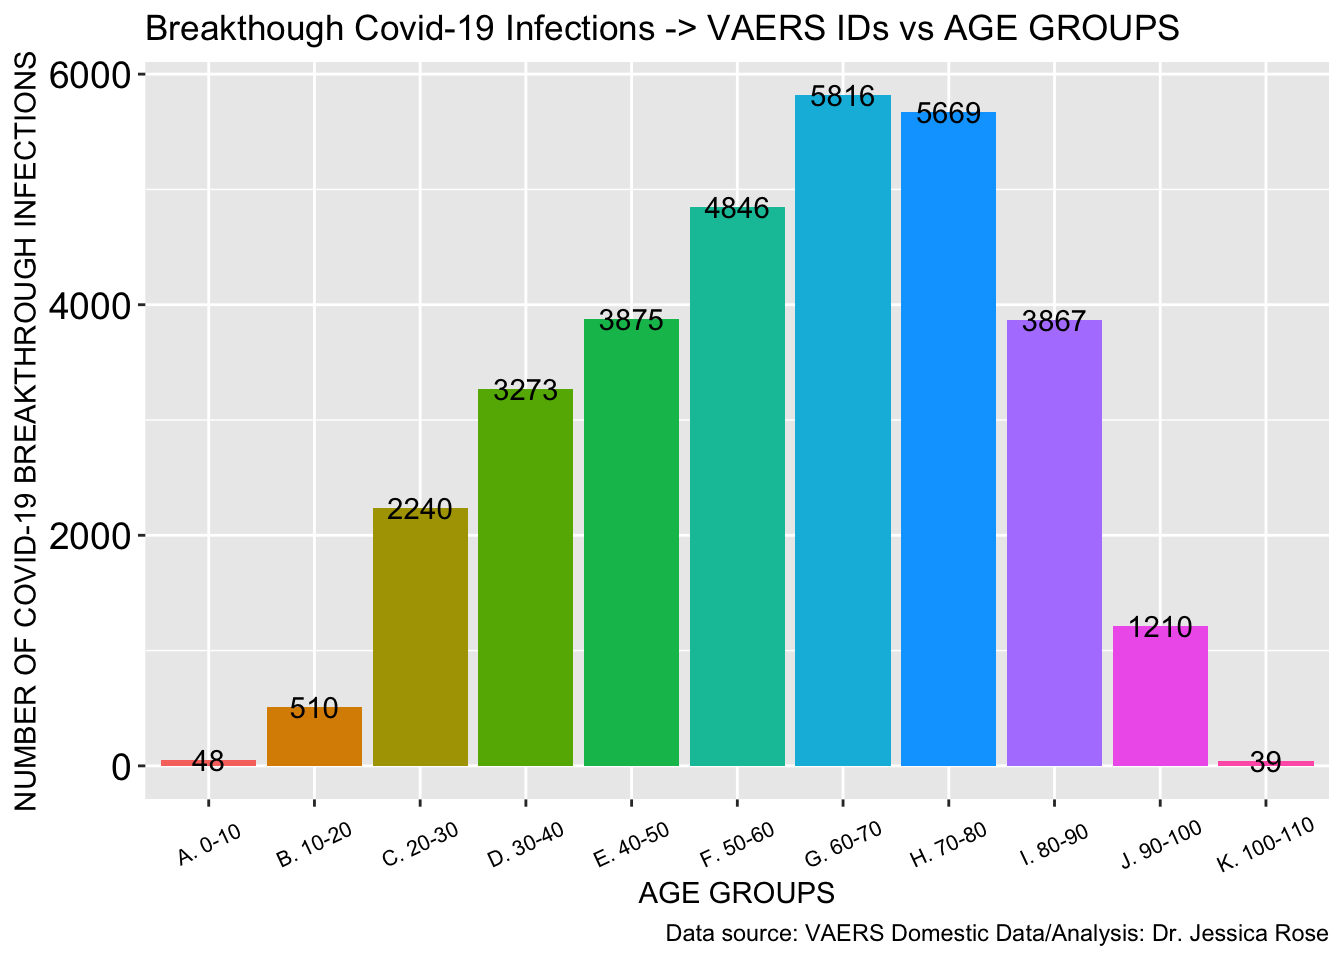
Female Reproductive Events count
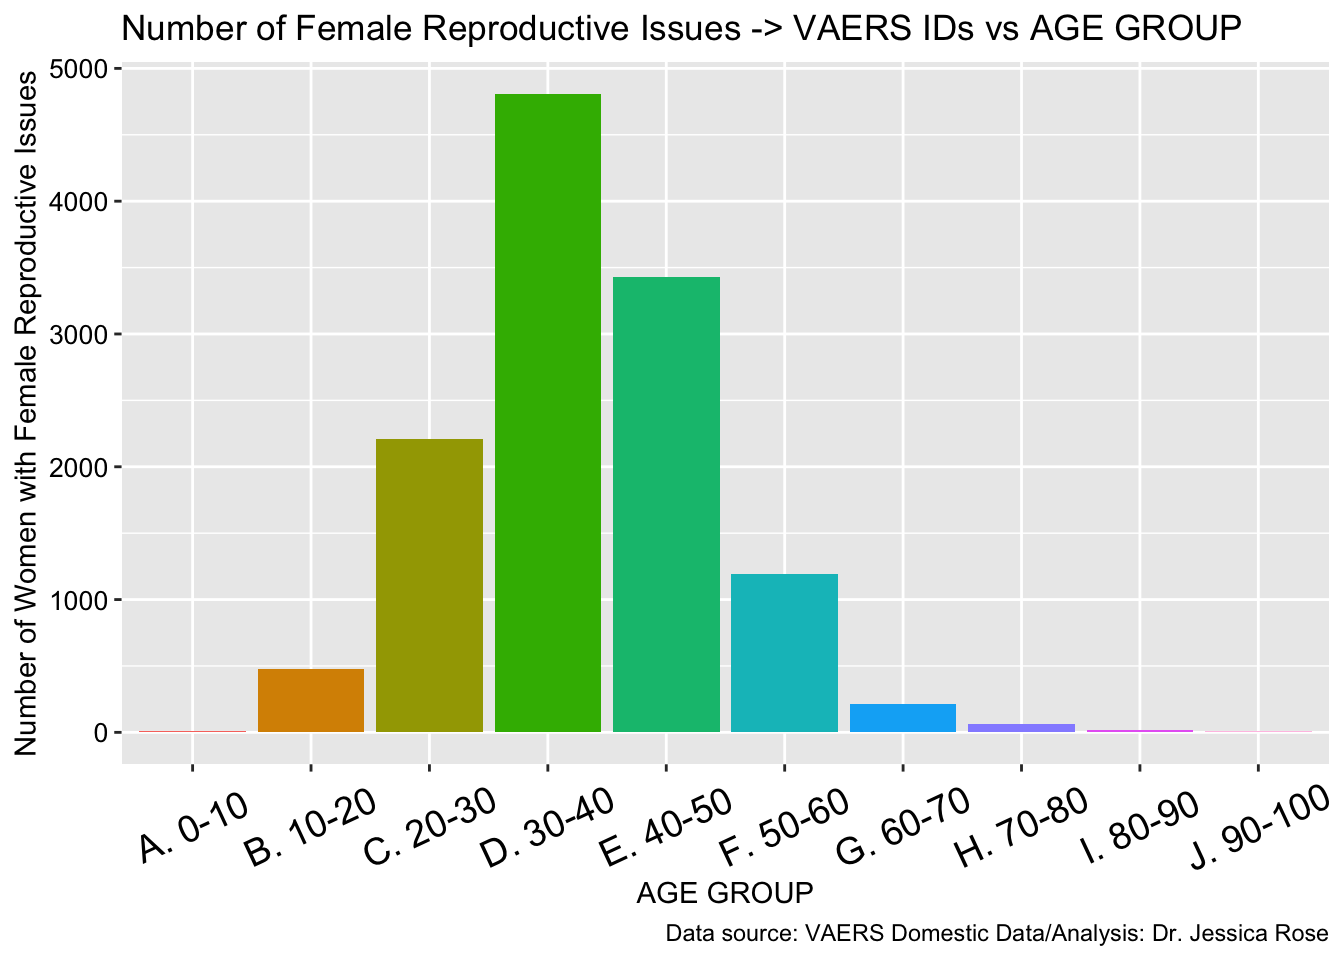
## [1] 12891## [1] 1.735199Histogram showing distribution of Female Reproductive Issues by age group
##
## Chi-squared test for given probabilities
##
## data: FRI_CASES_VD_OD$OBSERVED
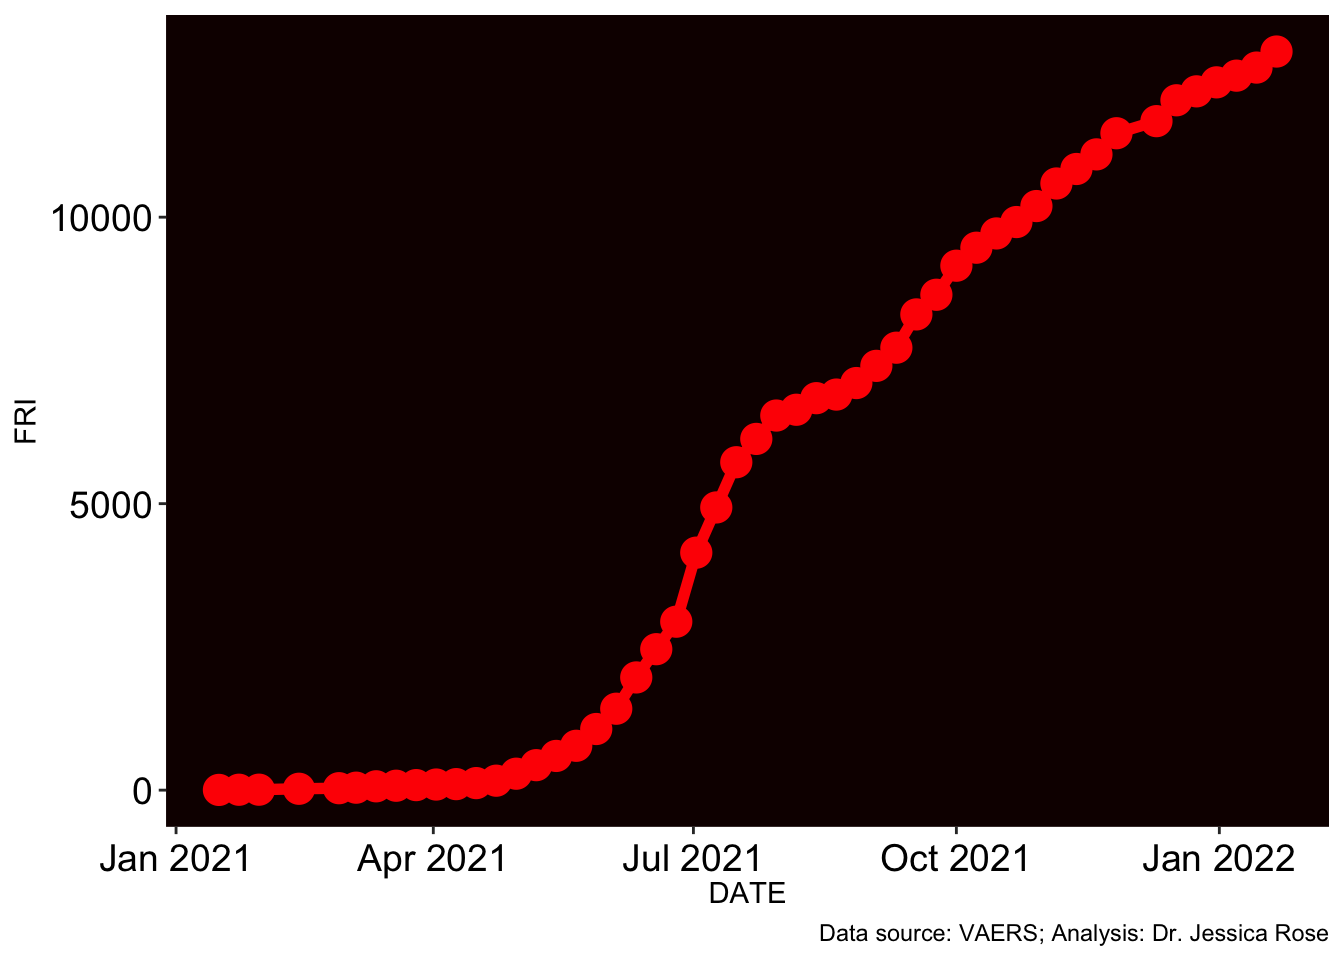
## X-squared = 30874, df = 50, p-value < 2.2e-16Cumulative FRI cases as per update - rates increasing.
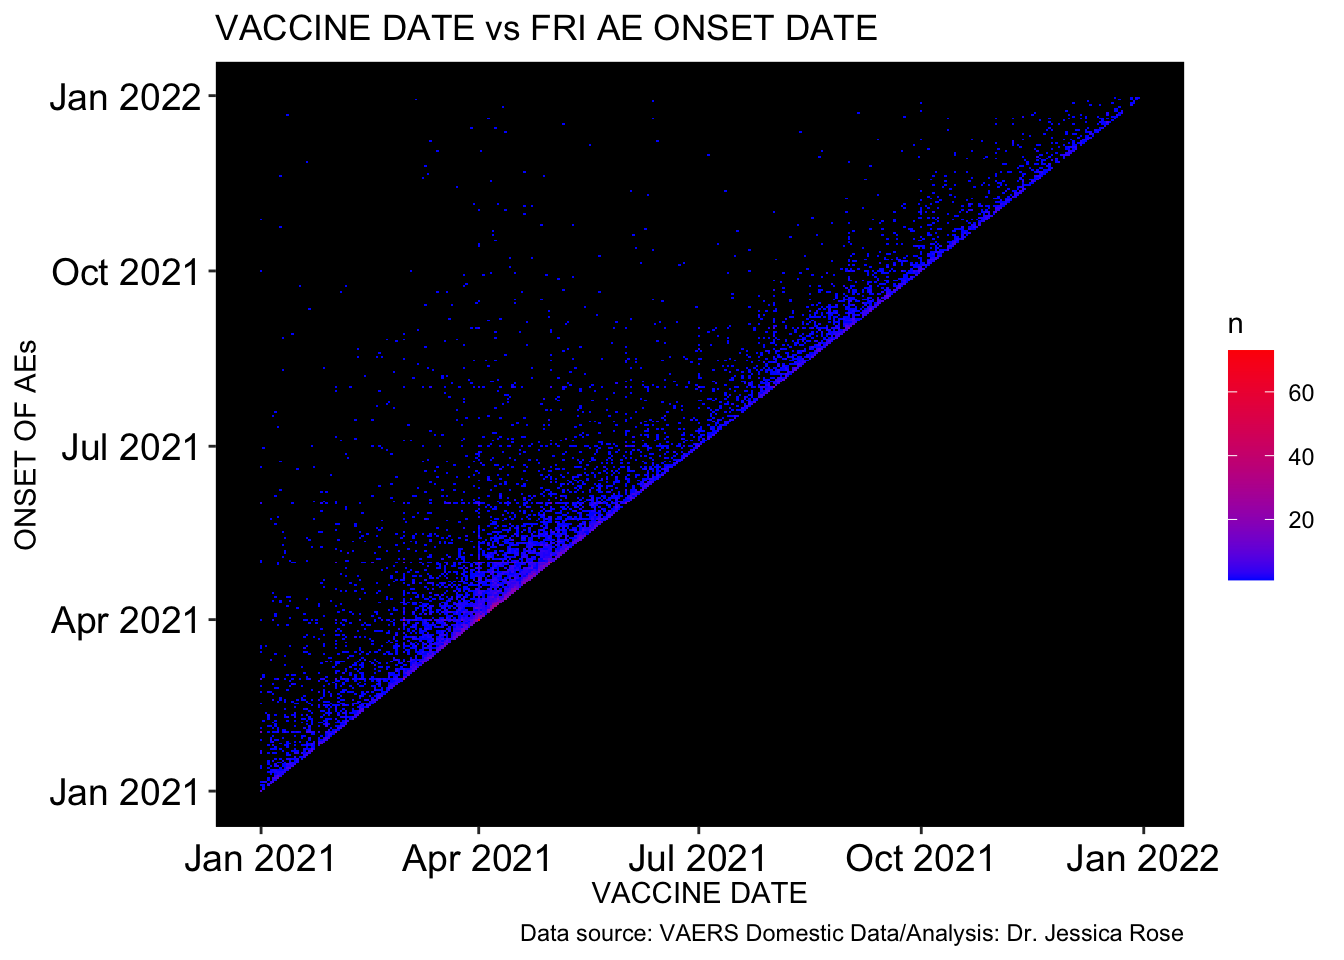
 Heatmap showing Female Reproductive Issues wrt VAX DATE and ONSET DATE. Early April shows a clustering of intersecting points.
 Cardiac Events Count
## [1] "Arrhythmia"
## [2] "Myocarditis"
## [3] "Pericarditis"
## [4] "Endocarditis"
## [5] "Cardiac arrest"
## [6] "Chest pain"
## [7] "Myocardial infarction"
## [8] "Pericardial effusion"
## [9] "Aneurysm"
## [10] "Blood fibrinogen"
## [11] "Blood fibrinogen increased"
## [12] "Circulatory collapse"
## [13] "C-reactive protein decreased"
## [14] "C-reactive protein increased"
## [15] "Deep vein thrombosis"
## [16] "Dizziness"
## [17] "Fatigue"
## [18] "Fibrin D dimer increased"
## [19] "Irregular breathing"
## [20] "Ischaemia"
## [21] "Microembolism"
## [22] "Pallor"
## [23] "Palpitations"
## [24] "Platelet count decreased"
## [25] "Platelet count increased"
## [26] "Red blood cell count abnormal"
## [27] "Red blood cell count decreased"
## [28] "Red blood cell count increased"
## [29] "Red blood cell rouleaux formation present"
## [30] "Red blood cell schistocytes present"
## [31] "Syncope"
## [32] "Troponin"
## [33] "Troponin increased"
## [34] "Troponin I"
## [35] "Troponin I increased"
## [36] "Troponin T increased"
## [37] "Thrombosis"
## [38] "Echocardiogram abnormal"
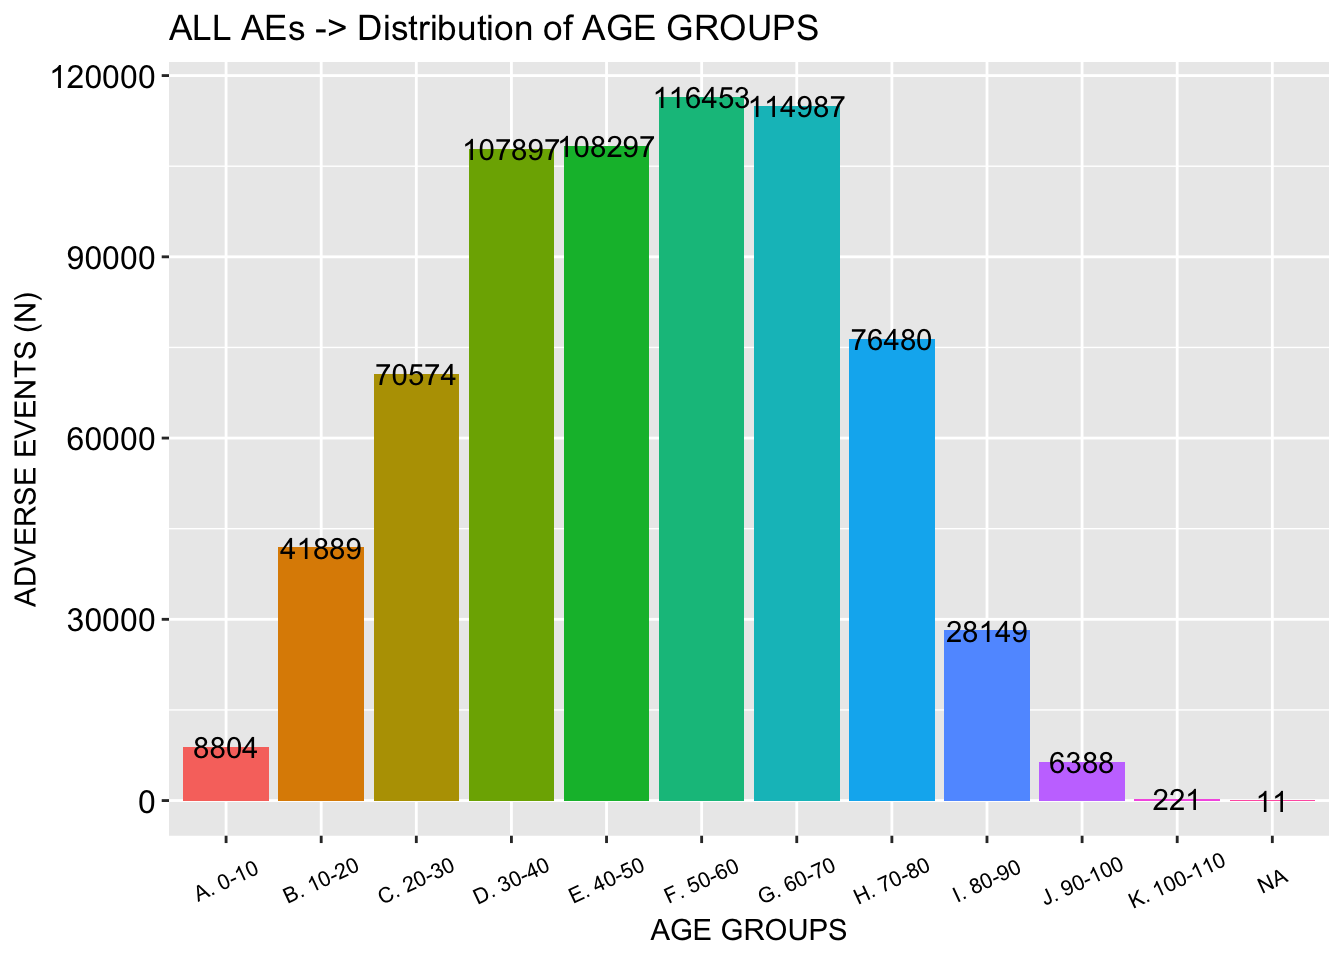
## [39] "Dyspnoea"## [1] 213190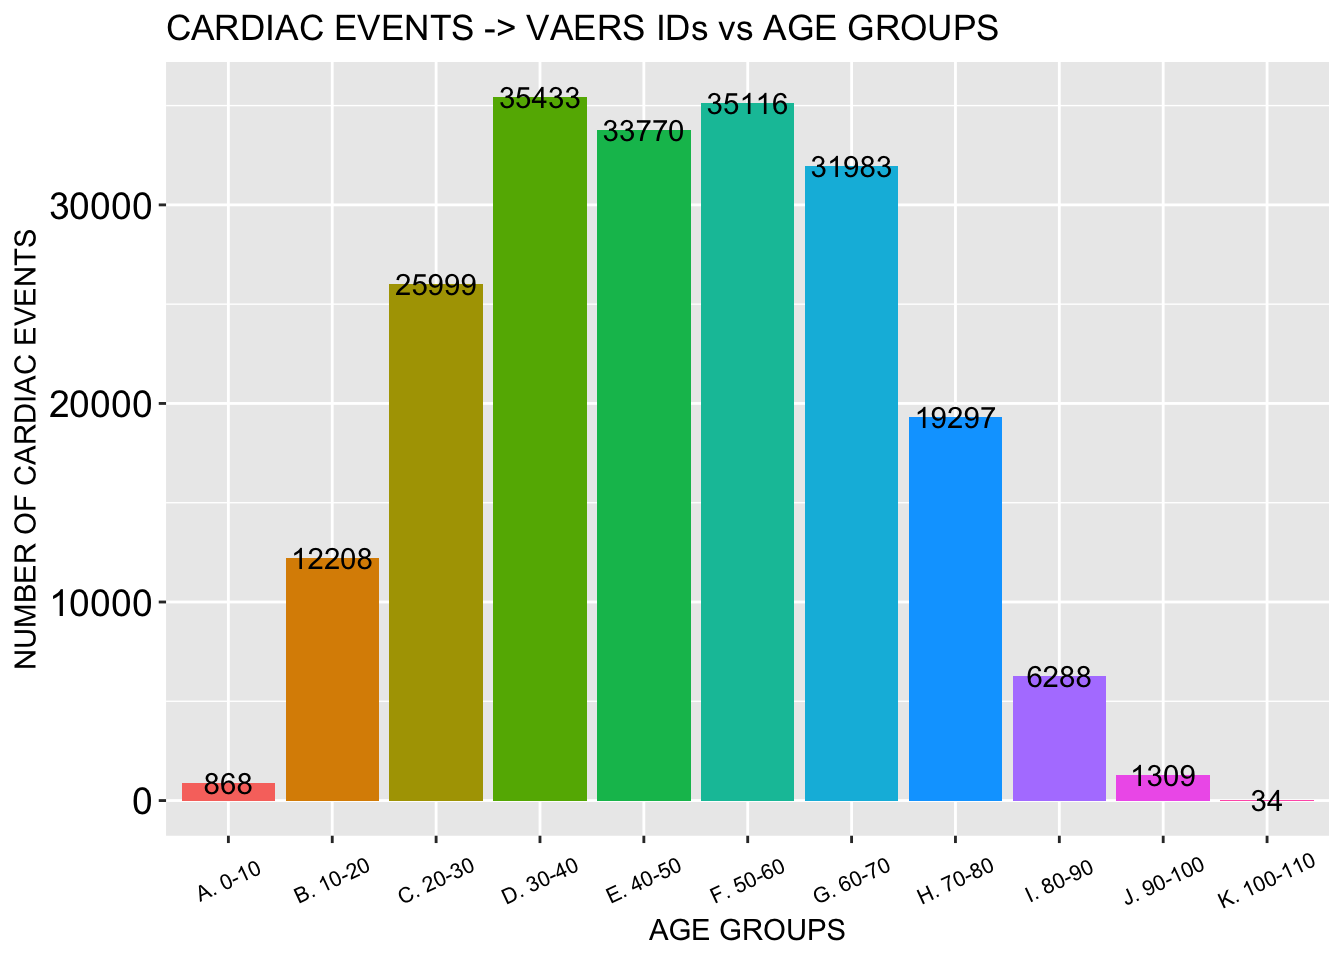 This is the number of kids aged 12-18 reported to VAERS with AEs, the percentage of the total AEs reported and a histogram showing age group distribution.
## [1] 33582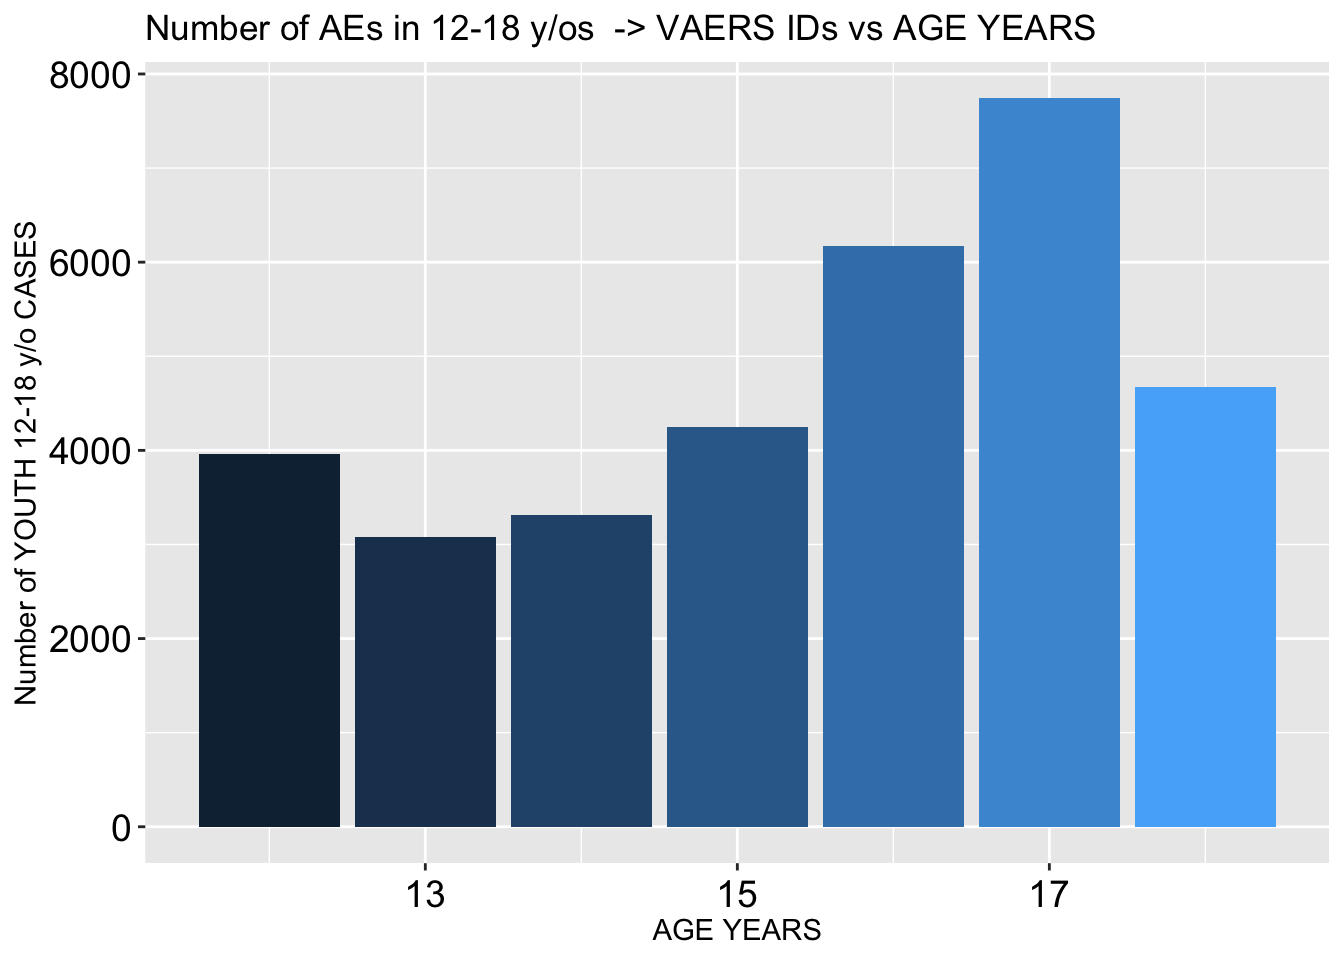
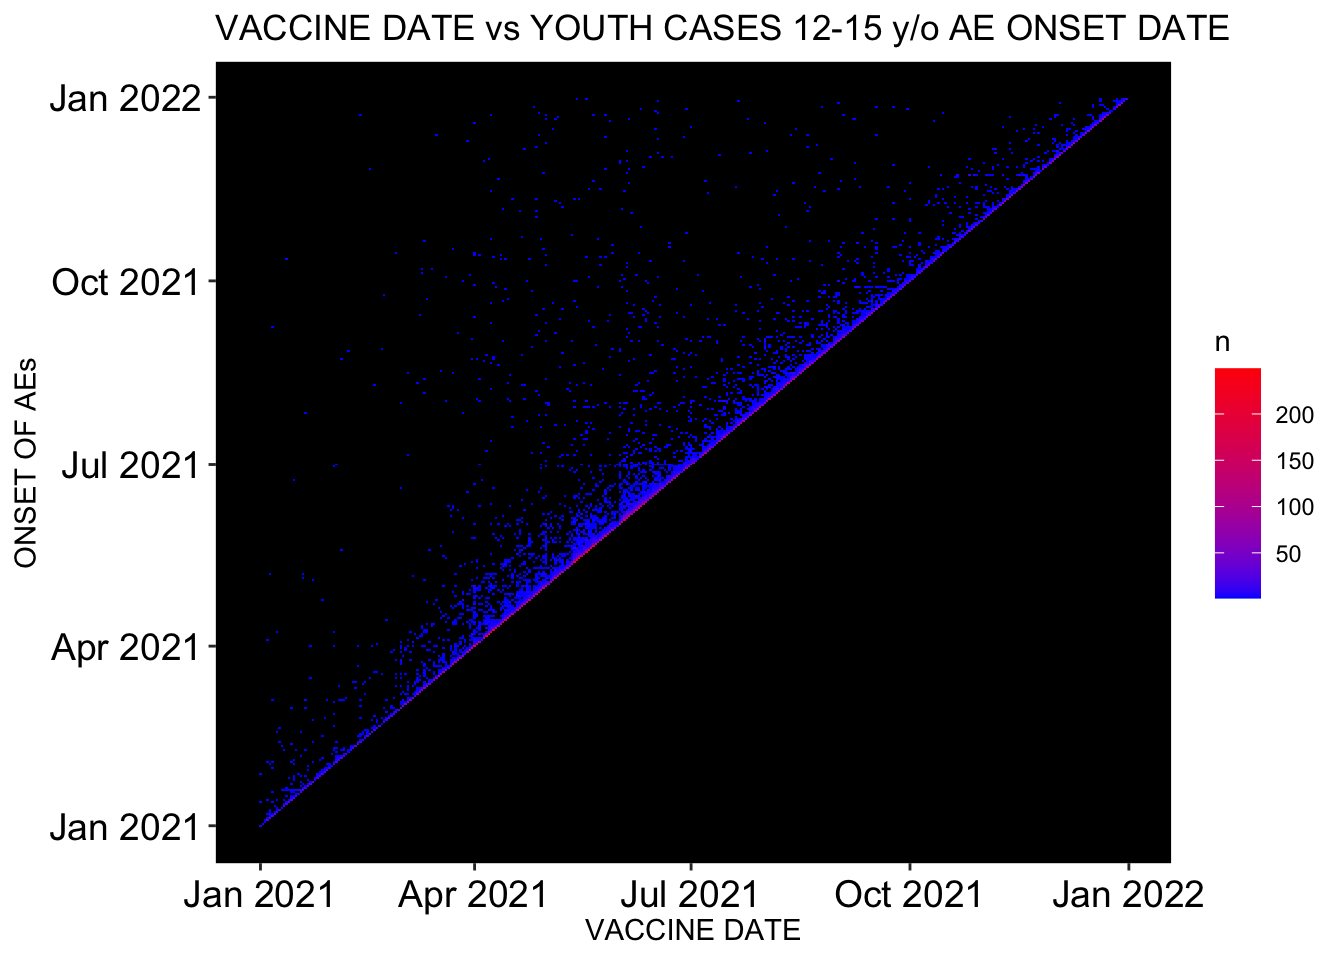
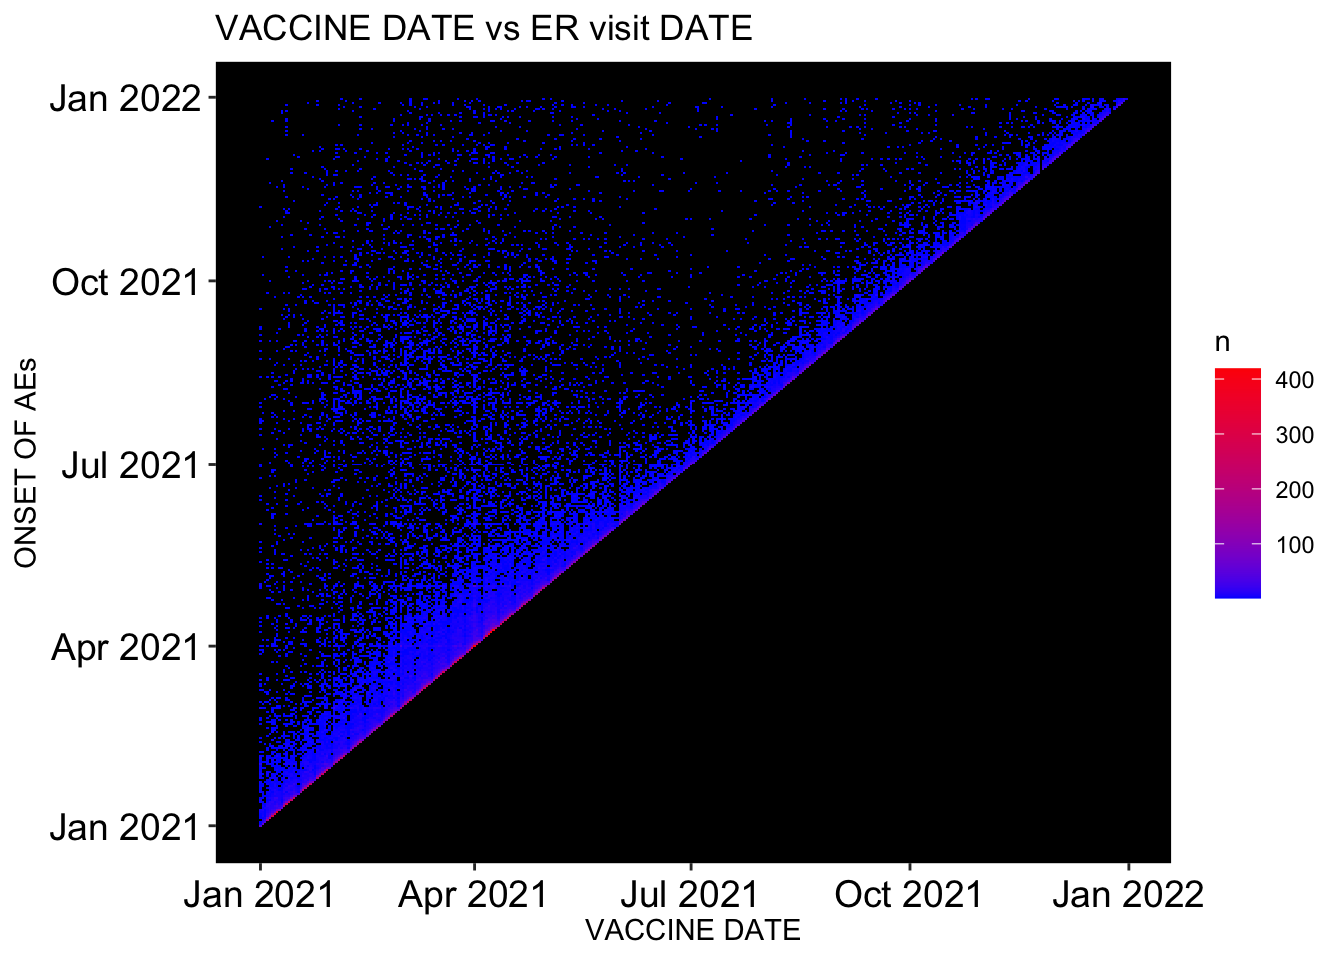
## [1] 31459## [1] 4.234553And this is a heatmap showing 1:1 correlation between onset of AE and injection date.
## # A tibble: 3,689 × 4
## # Groups:   VAX_DATE, ONSET_DATE [3,689]
##    VAX_DATE   ONSET_DATE diff_in_days     n
##    <date>     <date>     <drtn>       <int>
##  1 2021-05-14 2021-05-14 0 days         249
##  2 2021-05-19 2021-05-19 0 days         248
##  3 2021-05-15 2021-05-15 0 days         216
##  4 2021-05-13 2021-05-13 0 days         208
##  5 2021-04-07 2021-04-07 0 days         204
##  6 2021-05-18 2021-05-18 0 days         202
##  7 2021-04-06 2021-04-06 0 days         186
##  8 2021-04-09 2021-04-09 0 days         186
##  9 2021-05-21 2021-05-21 0 days         186
## 10 2021-04-08 2021-04-08 0 days         183
## # … with 3,679 more rows
Here we have the percentage of cardiac cases for kids aged 12-15 of the total youth population (12-18) in VAERS, the percentage of cardiac AEs that come from youths and the percentage of cardiac cases in kids aged 12-15 of the total cardiac AEs.
## [1] 13.89745## [1] 14.75632## [1] 2.050753Immunological Adverse Effects Count
##  [1] "Anaphylactic reaction"
##  [2] "Anaphylactic shock"
##  [3] "Anaphylactoid reaction"
##  [4] "Autoimmune demyelinating disease"
##  [5] "Autoimmune disorder"
##  [6] "Autoimmune thyroiditis"
##  [7] "Chills"
##  [8] "Cytokine storm"
##  [9] "Drug reaction with eosinophilia and systemic symptoms"
## [10] "Dysgeusia"
## [11] "Dysphagia"
## [12] "Encephalomyelitis"
## [13] "Erythema"
## [14] "Febrile neutropenia"
## [15] "Fungal infection"
## [16] "Genital rash"
## [17] "Guillain-Barre syndrome"
## [18] "Haemorrhage subepidermal"
## [19] "Hepatitis"
## [20] "Hepatitis acute"
## [21] "Herpes simplex"
## [22] "Herpes simplex encephalitis"
## [23] "Herpes simplex reactivation"
## [24] "Herpes virus infection"
## [25] "Herpes zoster"
## [26] "Herpes zoster cutaneous disseminated"
## [27] "Hyperpyrexia"
## [28] "Immediate post-injection reaction"
## [29] "Immune thrombocytopenia"
## [30] "Inflammation"
## [31] "Leukopenia"
## [32] "Lymphadenitis"
## [33] "Lymphadenopathy"
## [34] "Malaise"
## [35] "May-Thurner syndrome"
## [36] "Meningitis"
## [37] "Meningitis aseptic"
## [38] "Meningitis viral"
## [39] "Myelitis"
## [40] "Multiple sclerosis relapse"
## [41] "Multiple allergies"
## [42] "Myelitis transverse"
## [43] "Neuritis"
## [44] "Noninfective encephalitis"
## [45] "Ophthalmic herpes simplex"
## [46] "Oral herpes"
## [47] "Oral viral infection"
## [48] "Pancreatitis"
## [49] "Pancreatitis acute"
## [50] "Parkinsonism"
## [51] "Peptostreptococcus infection"
## [52] "Periarthritis"
## [53] "Pneumonia viral"
## [54] "Pruritus"
## [55] "Rash"
## [56] "Rash erythematous"
## [57] "Rash macular"
## [58] "Rash maculo-papular"
## [59] "Rash morbilliform"
## [60] "Rash papular"
## [61] "Rash pruritic"
## [62] "Rash pustular"
## [63] "Rash vesicular"
## [64] "Reaction to excipient"
## [65] "Rheumatoid arthritis"
## [66] "Butterfly rash"
## [67] "Necrosis"
## [68] "Stevens-Johnson syndrome"
## [69] "Systemic lupus erythematosus"
## [70] "Systemic lupus erythematosus rash"
## [71] "Systemic scleroderma"
## [72] "Thrombophlebitis"
## [73] "Type III immune complex mediated reaction"
## [74] "Urticaria"
## [75] "Varicella zoster virus infection"
## [76] "Vestibular neuronitis"
## [77] "Viral cardiomyopathy"
## [78] "Viral infection"
## [79] "Viral pericarditis"
## [80] "Viral rash"
## [81] "Systemic scleroderma"
Here we have the total AE count for immunological adverse events as per the list above. This is a very short list as compared with the total number of immunological AEs. It is merely a representation.
## [1] 218196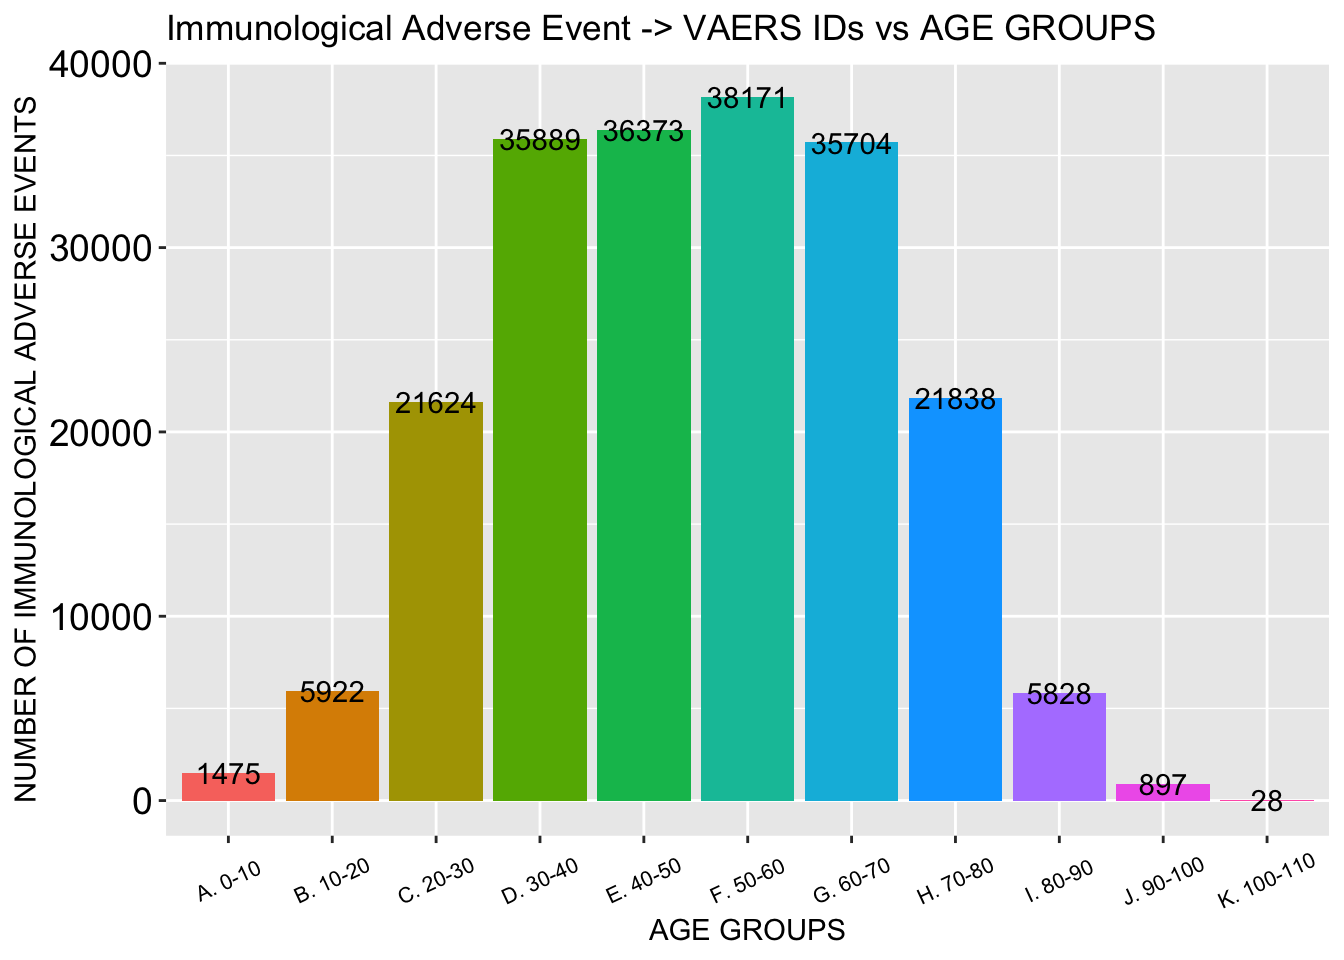
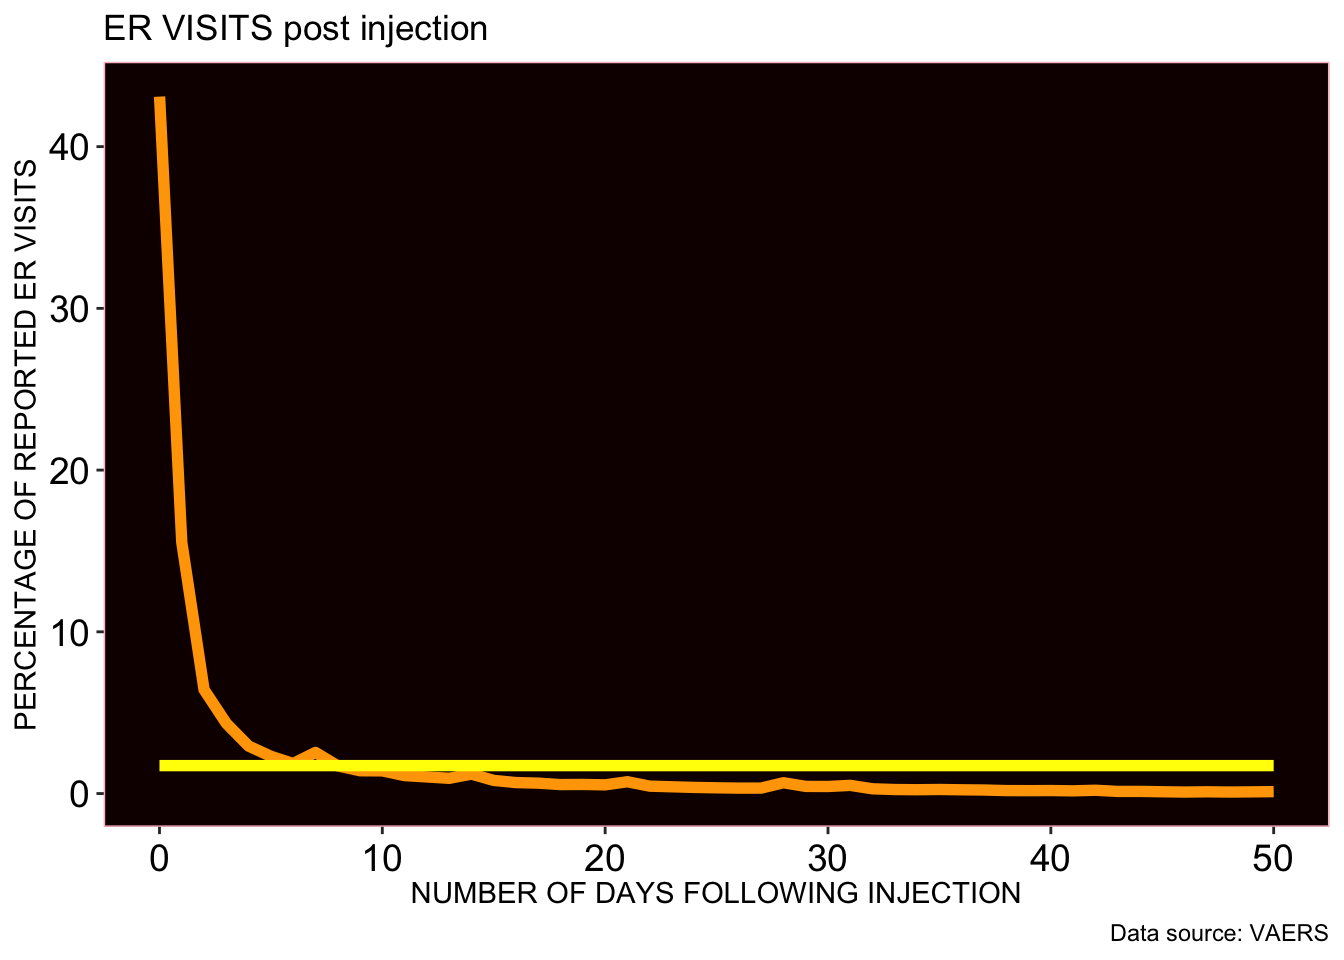
## diff_in_days n OBSERVED Percentage_OBSERVED EXPECTED Percentage_EXPECTED
## 1 0 days 78122 78122 42.2751821 8799 4.032613
## 2 1 days 52191 52191 28.2428001 8799 4.032613
## 3 2 days 12356 12356 6.6863643 8799 4.032613
## 4 7 days 6539 6539 3.5385348 8799 4.032613
## 5 3 days 6207 6207 3.3588753 8799 4.032613
## 6 8 days 5171 5171 2.7982510 8799 4.032613
## 7 4 days 3934 3934 2.1288570 8799 4.032613
## 8 5 days 3370 3370 1.8236523 8799 4.032613
## 9 6 days 3295 3295 1.7830665 8799 4.032613
## 10 9 days 2991 2991 1.6185590 8799 4.032613
## 11 10 days 2214 2214 1.1980908 8799 4.032613
## 12 11 days 1617 1617 0.8750284 8799 4.032613
## 13 14 days 1424 1424 0.7705878 8799 4.032613
## 14 12 days 1282 1282 0.6937455 8799 4.032613
## 15 13 days 1039 1039 0.5622477 8799 4.032613
## 16 15 days 697 697 0.3771767 8799 4.032613
## 17 16 days 547 547 0.2960053 8799 4.032613
## 18 17 days 531 531 0.2873470 8799 4.032613
## 19 18 days 442 442 0.2391853 8799 4.032613
## 20 20 days 417 417 0.2256567 8799 4.032613
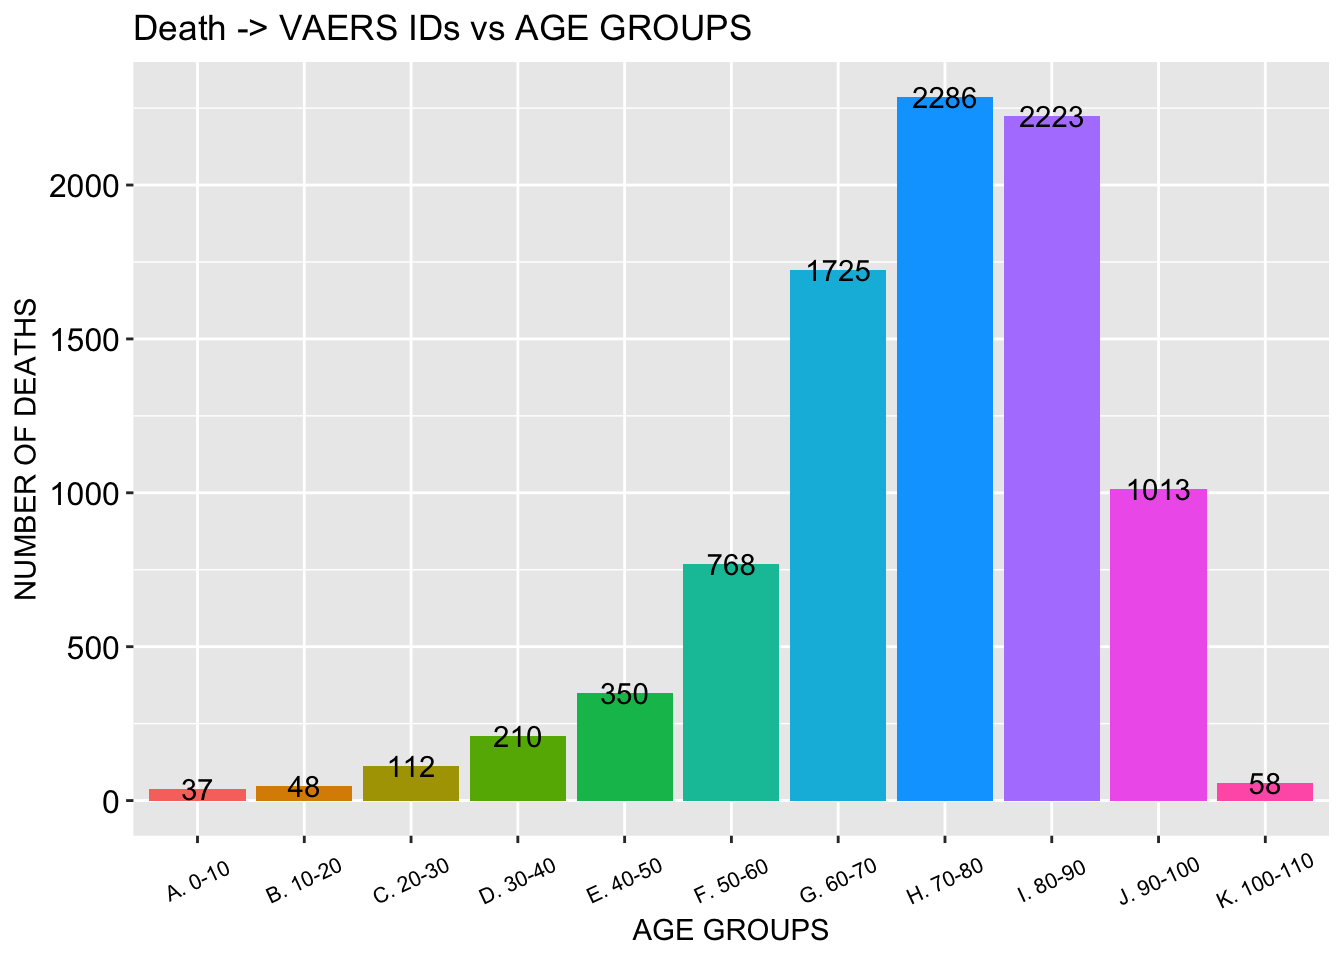
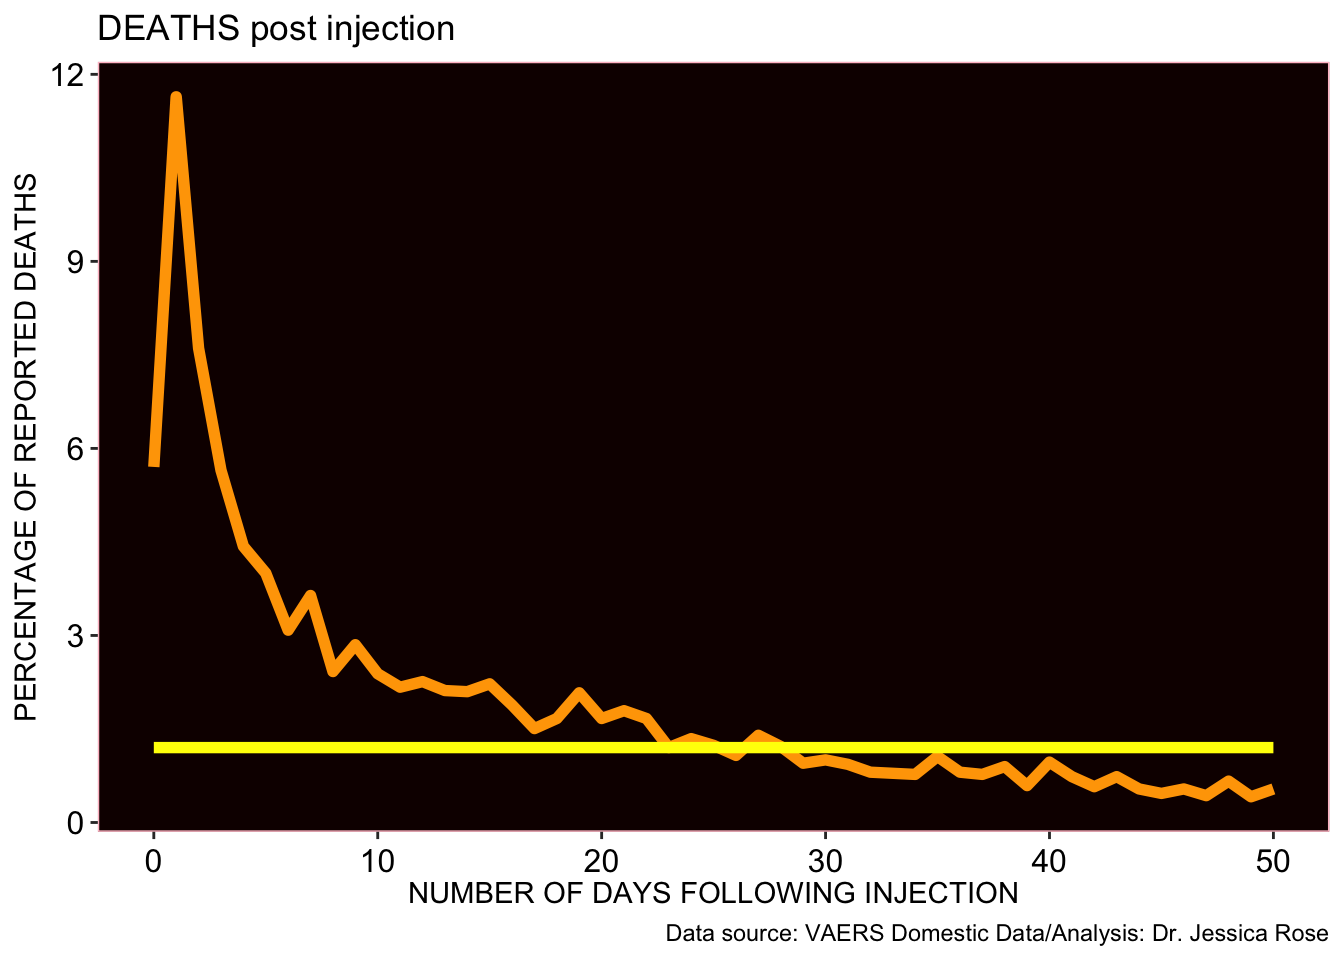
## 21 19 days 408 408 0.2207864 8799 4.032613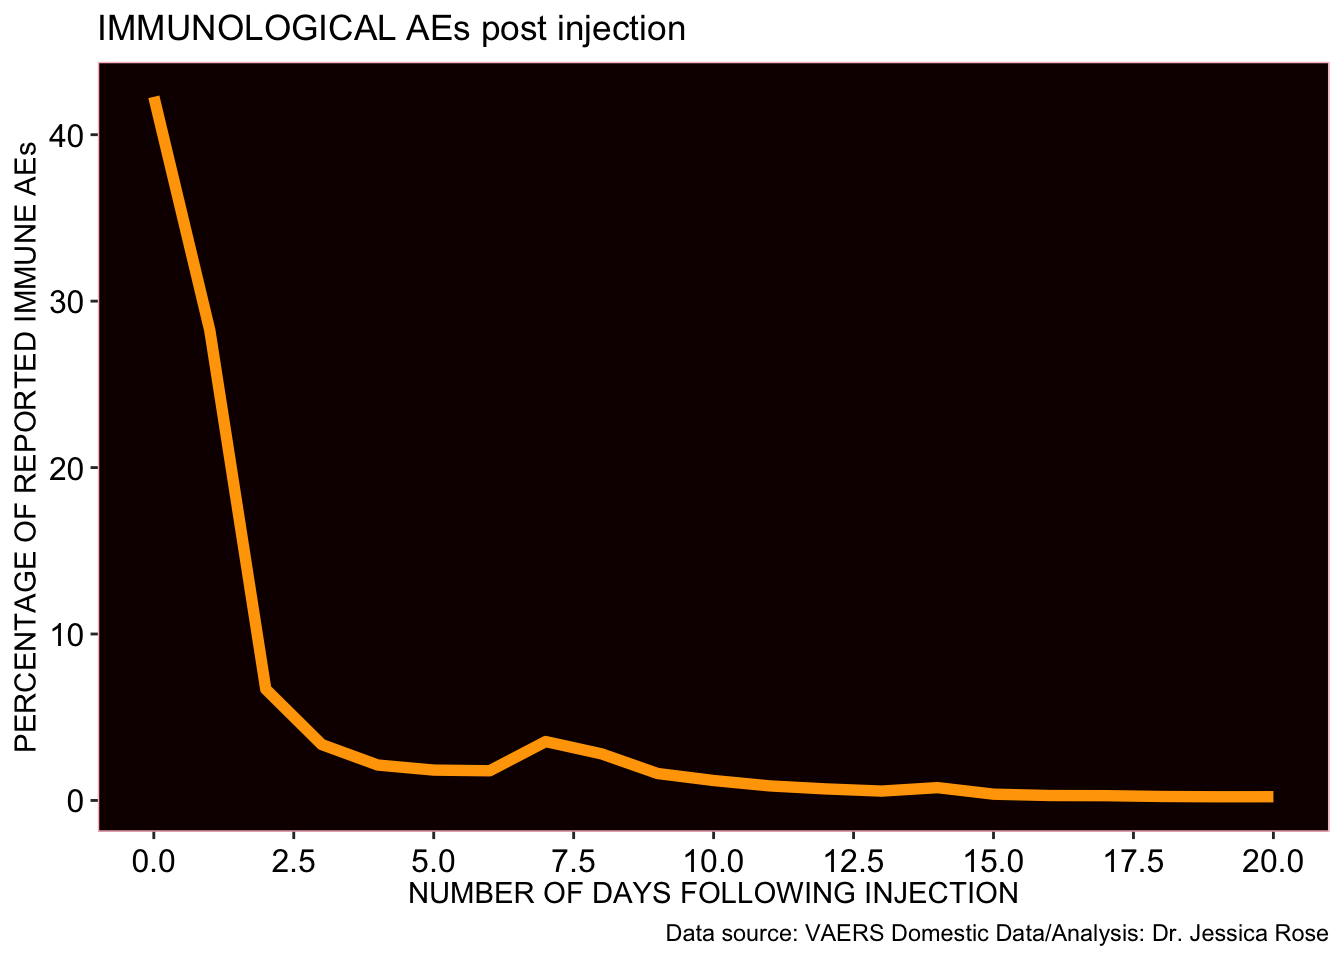 This is a histogram showing death distribution according to age group. We also have a time series plot showing clustering of data around day 1 following injection. And! We have a heatmap confirming strong correlation between injection date and death date. R=1 -> perfect correlation (look for red on diagonal).
## # A tibble: 51 × 6
##    diff_in_days     n OBSERVED Percentage_OBSERVED EXPECTED Percentage_EXPECTED
##    <drtn>       <int>    <int>               <dbl>    <int>               <dbl>
##  1 1 days         649      649               11.6       109                1.20
##  2 2 days         424      424                7.60      109                1.20
##  3 0 days         318      318                5.70      109                1.20
##  4 3 days         315      315                5.65      109                1.20
##  5 4 days         247      247                4.43      109                1.20
##  6 5 days         223      223                4.00      109                1.20
##  7 7 days         203      203                3.64      109                1.20
##  8 6 days         172      172                3.08      109                1.20
##  9 9 days         159      159                2.85      109                1.20
## 10 8 days         135      135                2.42      109                1.20
## # … with 41 more rows
Here is a histogram showing death distribution by age group.
 Here is a plot showing clustering of reports around 0 and 1 in the context of death.
## # A tibble: 6,337 × 5
## # Groups: DIED, DATEDIED, VAX_DATE [6,337]
## DIED DATEDIED VAX_DATE diff_in_days n
## <chr> <date> <date> <drtn> <int>
## 1 Y 2021-01-02 2021-01-02 0 days 1
## 2 Y 2021-01-03 2021-01-02 1 days 1
## 3 Y 2021-01-03 2021-01-03 0 days 1
## 4 Y 2021-01-04 2021-01-02 2 days 4
## 5 Y 2021-01-04 2021-01-03 1 days 1
## 6 Y 2021-01-04 2021-01-04 0 days 4
## 7 Y 2021-01-05 2021-01-02 3 days 1
## 8 Y 2021-01-05 2021-01-03 2 days 2
## 9 Y 2021-01-05 2021-01-04 1 days 2
## 10 Y 2021-01-05 2021-01-05 0 days 4
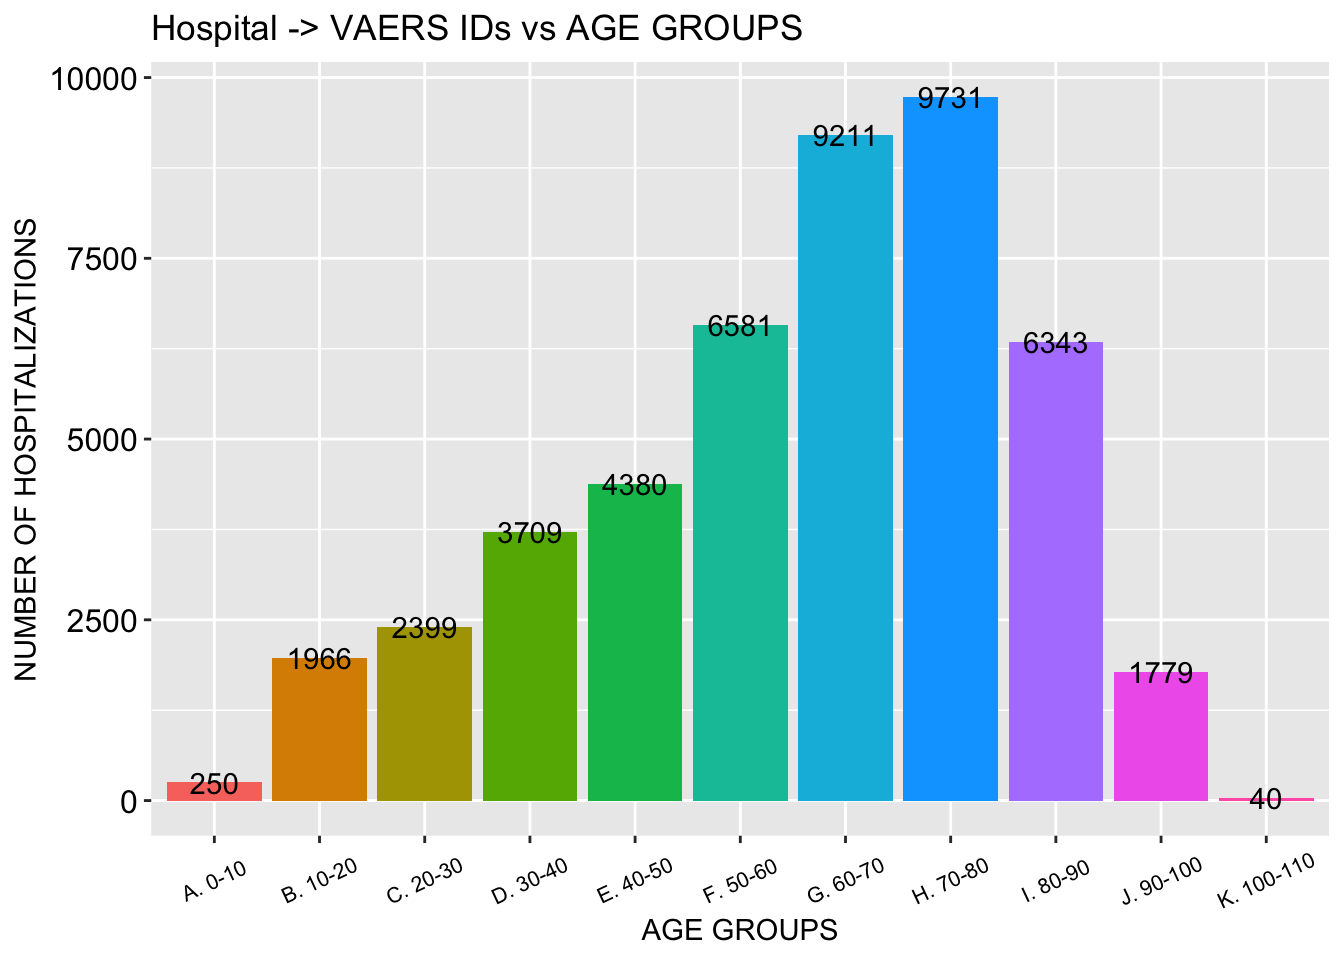
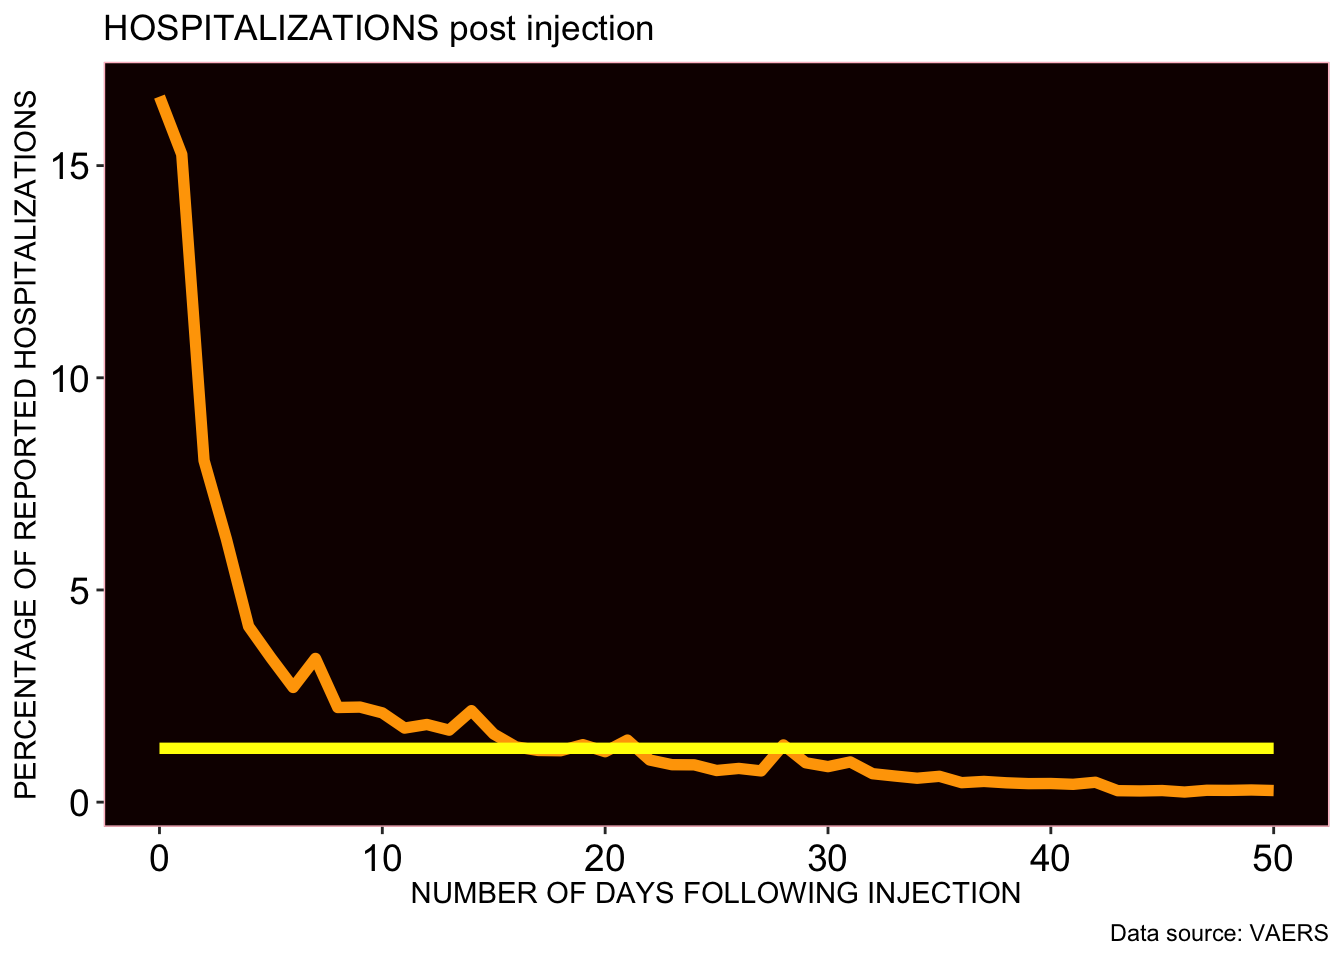
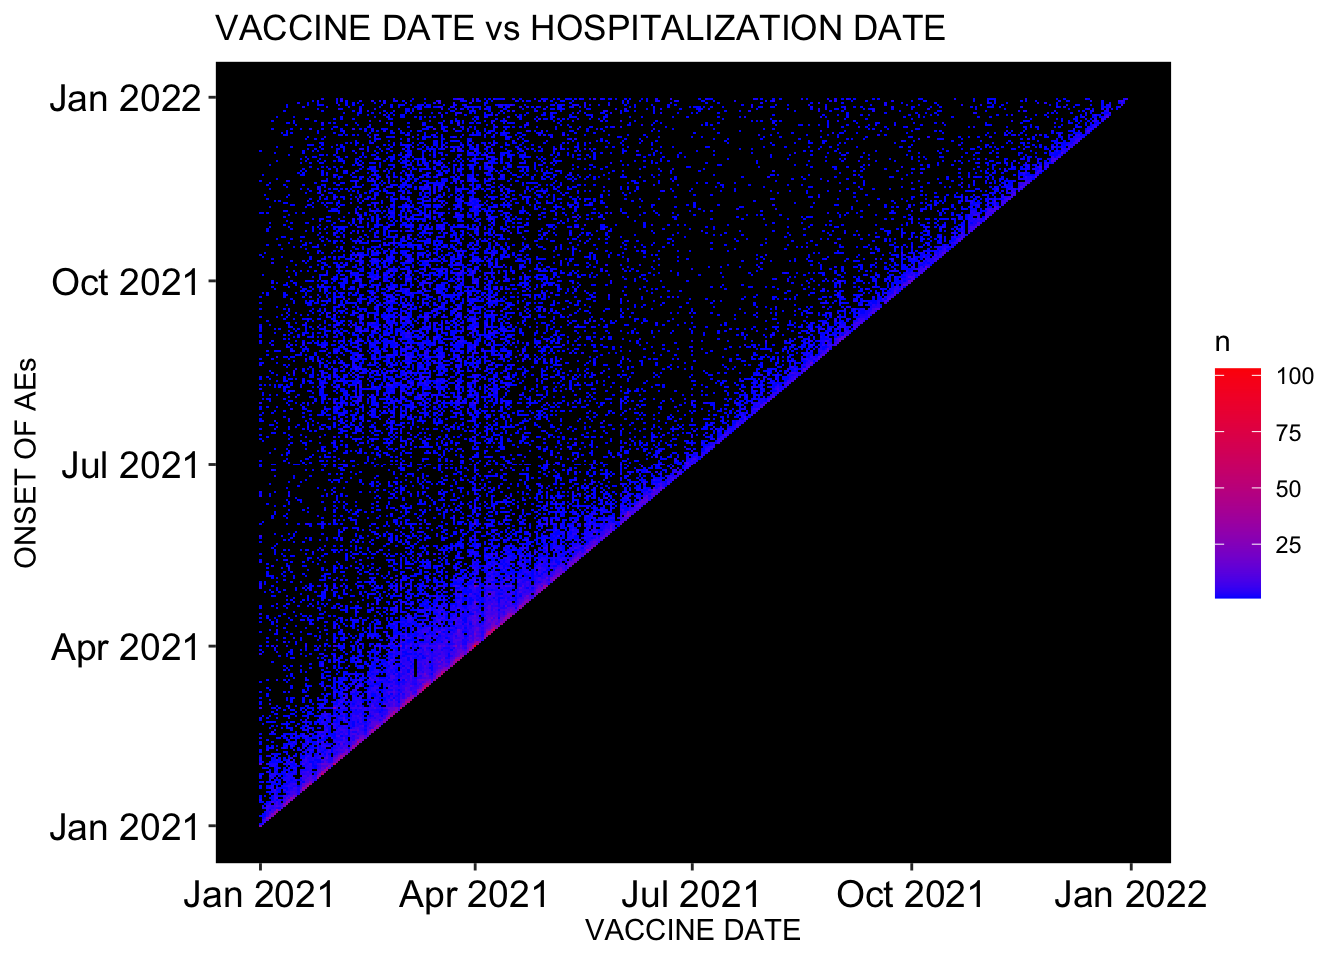
## # … with 6,327 more rows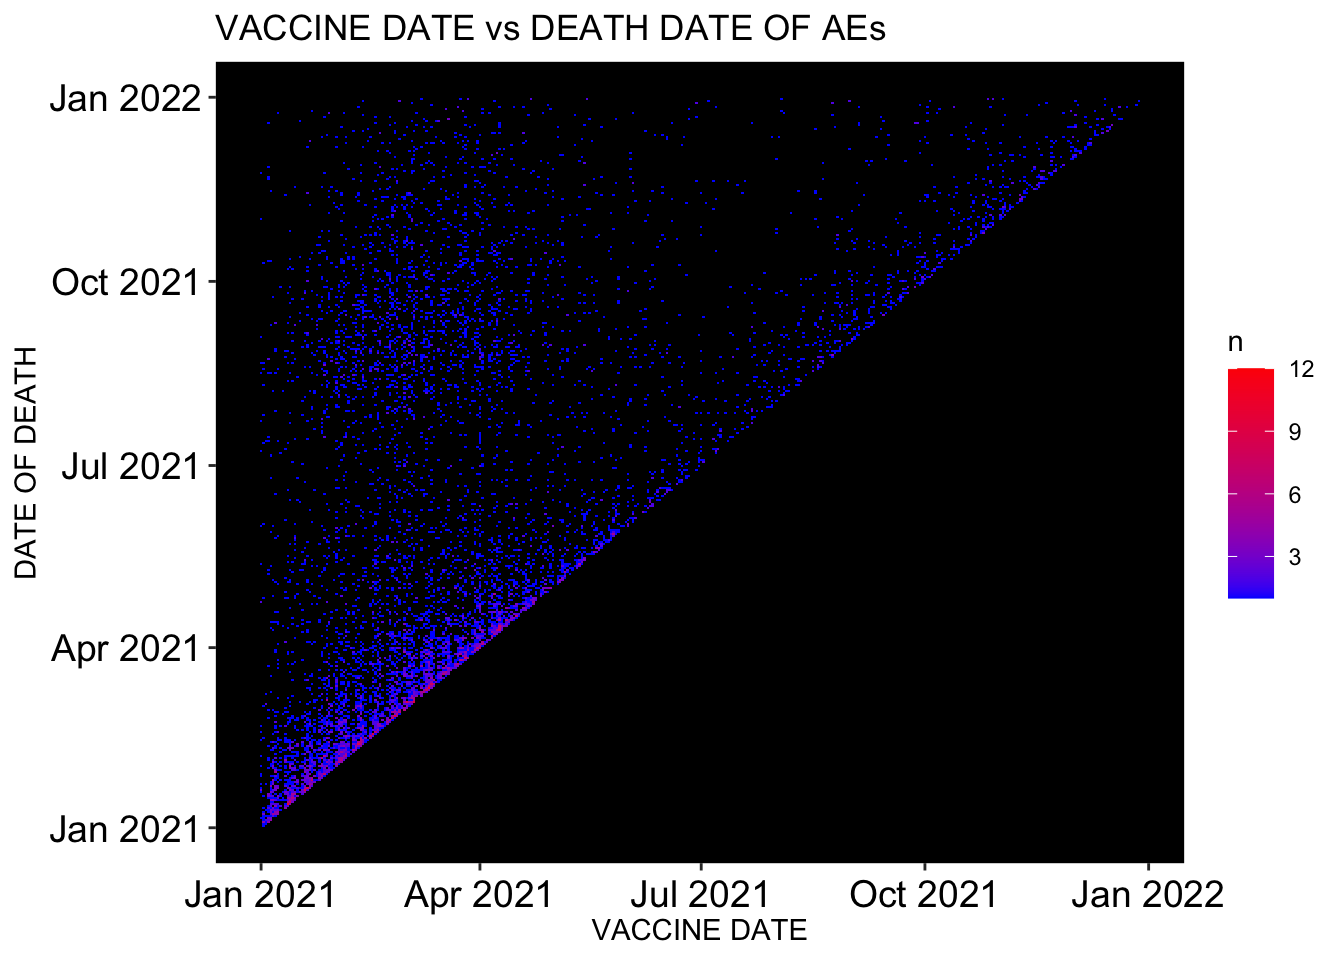 This is a histogram showing hospitalization distribution according to age group. We also have a time series plot showing clustering of data around day 1 following injection. And! We have a heatmap confirming strong correlation between injection date and hospitalization date. R=1 -> perfect correlation (look for red on diagonal).
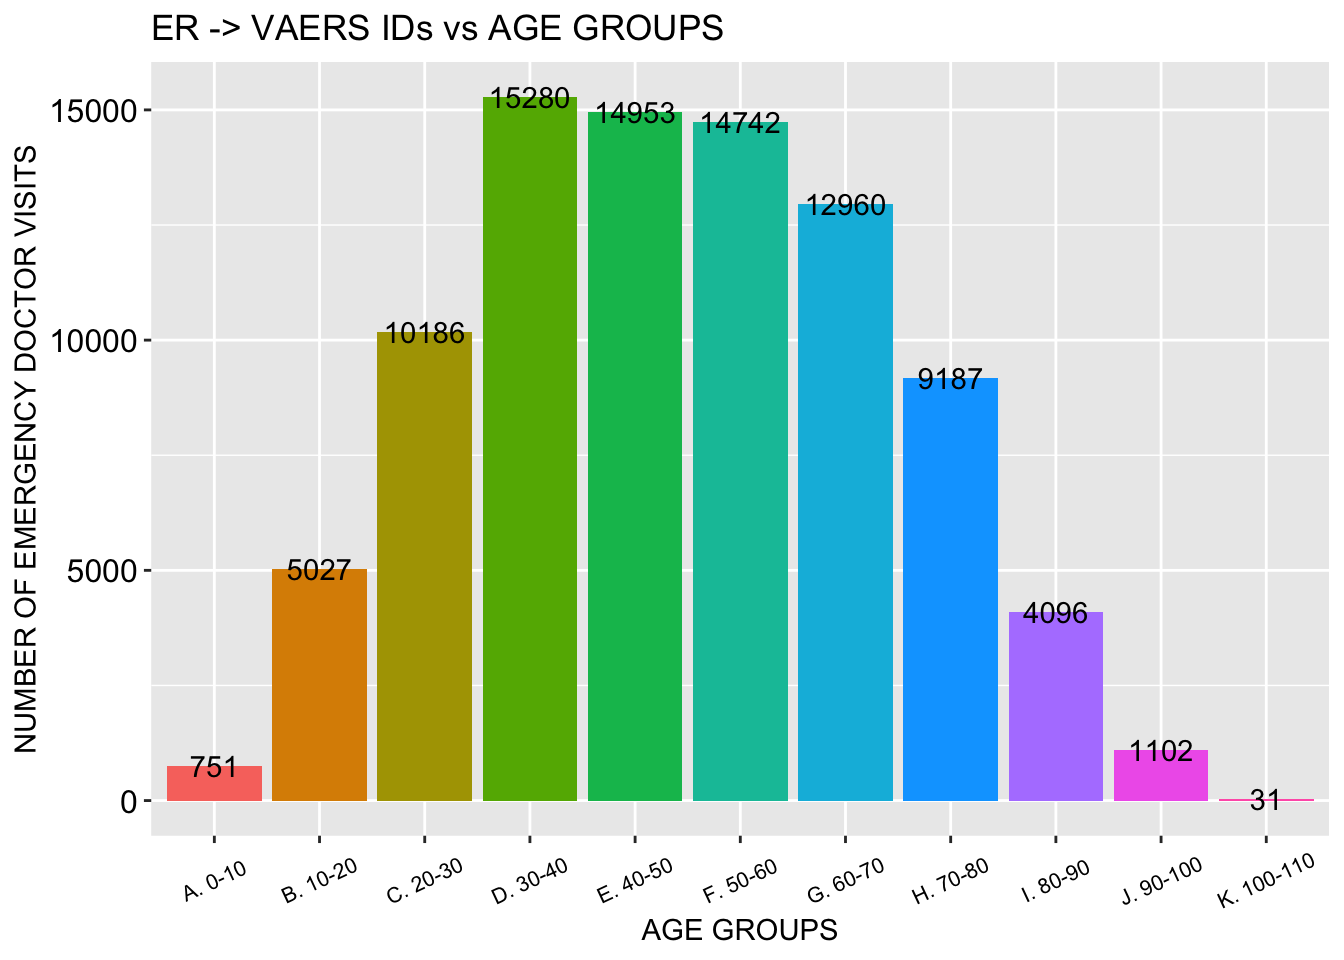
 This is a histogram showing ER distribution according to age group. We also have a time series plot showing clustering of data around day 1 following injection. And! We have a heatmap confirming strong correlation between injection date and ER date. R=1 -> perfect correlation (look for red on diagonal).
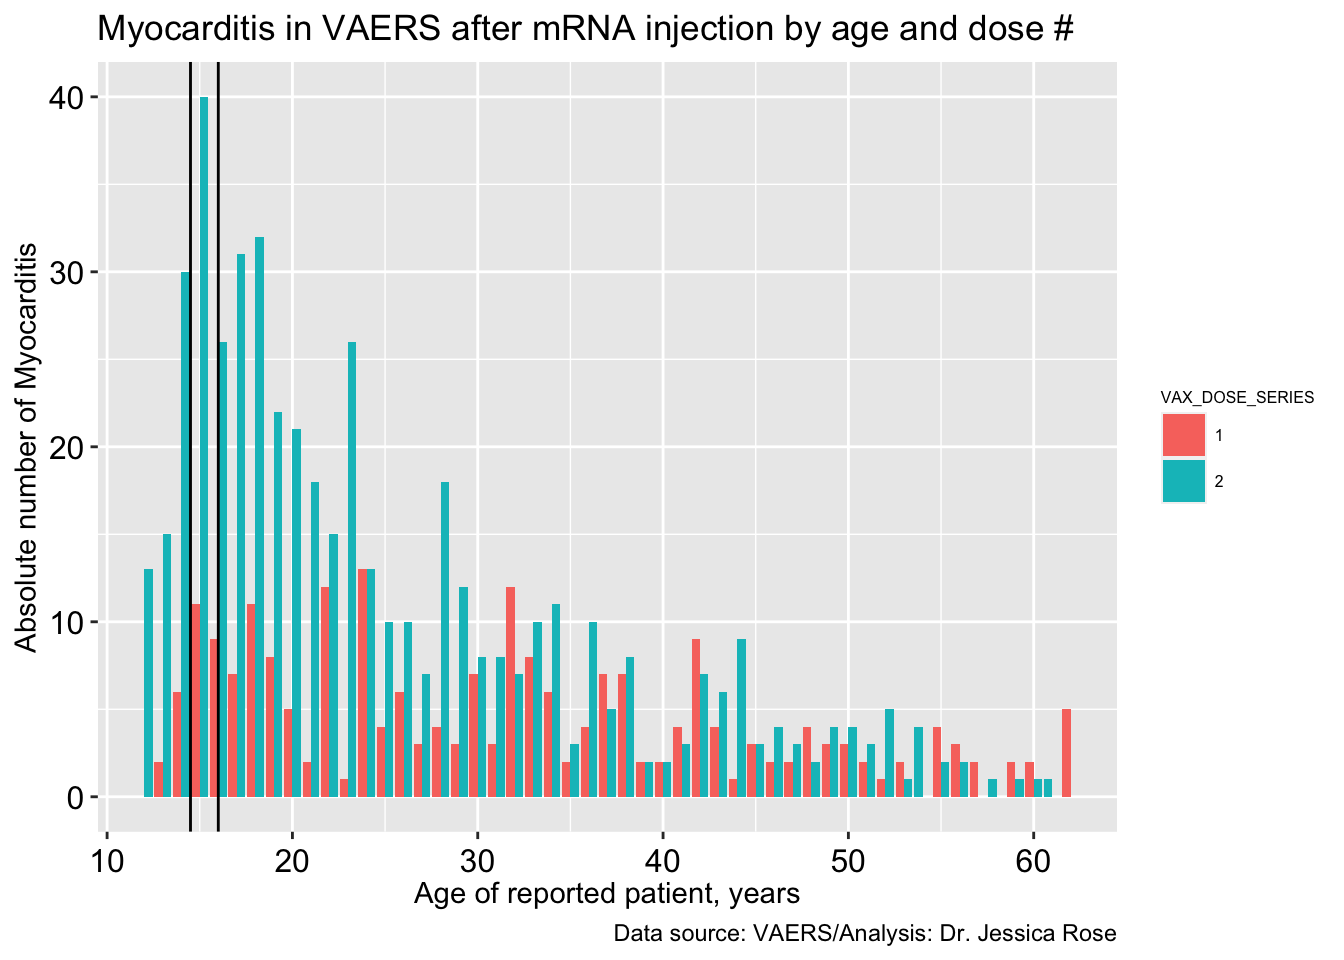
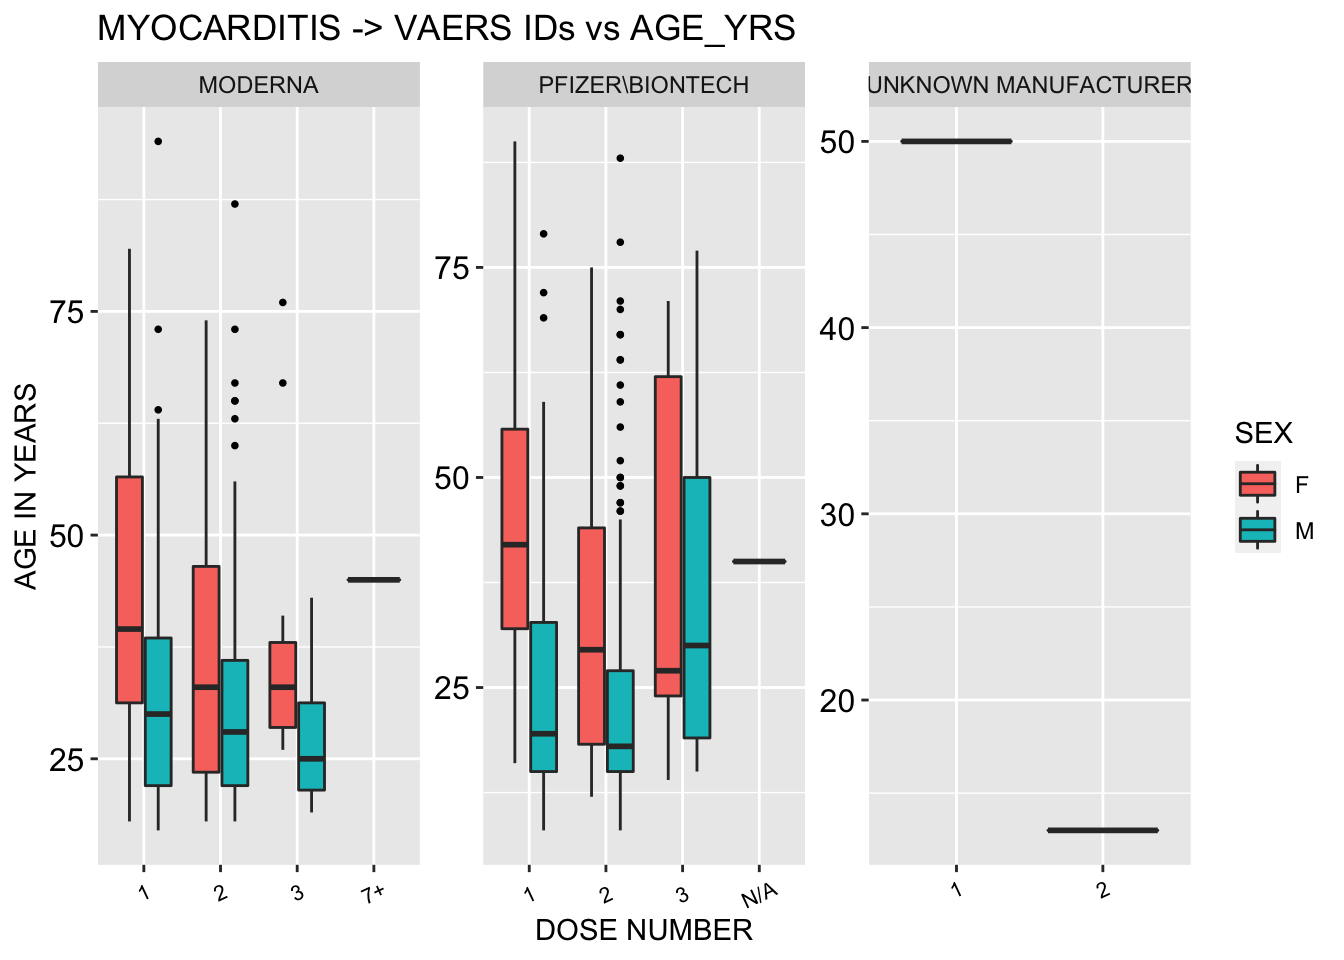
 And hey! What would this analysis be without myocarditis? This is the count of myocarditis cases and the percentage of the total count for cardiac cases and for the total AE count.
## [1] 1281## [1] 0.6008725## [1] 0.1724296And this plot shows age versus dose data for myocarditis cases using only the MedDRA code ‘myocarditis’. Notice how many young people. Hmm what’s that now? Dose 2 is causing moycarditis in young males? Hmm
 Are particular VAX LOTS being distributed to partuclar states? And are they more highly associated with death? Myocarditis?
Dr. Jessica Rose
Post Doctoral Researcher
My research interests include bioinformatics, applied mathematics, immunology, virology, computational biology, molecular biology and biochemistry.